Construction Schedule Intelligence Dashboard | Interactive Demo
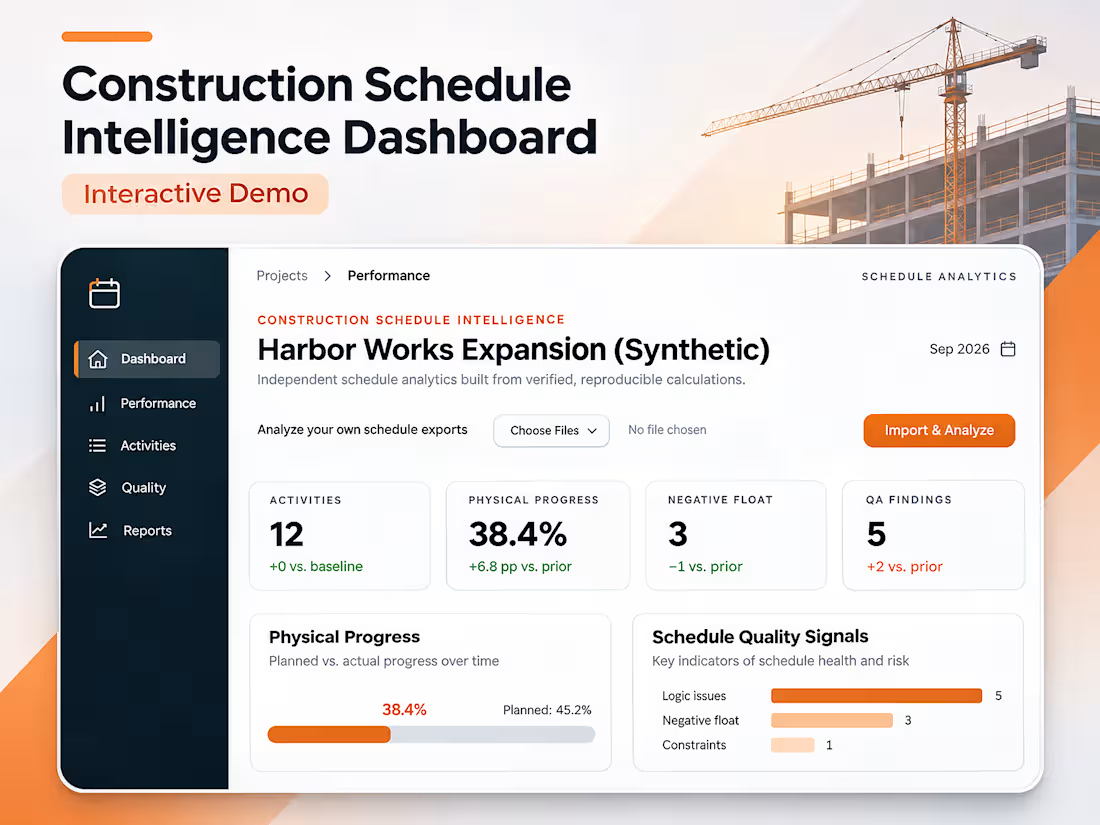
This video demonstrates an interactive, local-first construction schedule analytics dashboard designed to process Primavera P6 XER files, evaluate project performance, and identify scheduling risks.
Using the Harbor Works Expansion synthetic project, the walkthrough highlights how construction schedule data is transformed into measurable performance insights.
What the Video Demonstrates
Schedule Data Processing: An interactive dashboard populated with construction activity data and project scheduling information.
Project Health Metrics: 12 activities, 38.4% calculated physical progress, 3 negative-float activities, and 5 automated quality assurance findings.
Performance Visualization: Interactive progress tracking comparing 38.4% completion against a 33% baseline target.
Schedule Risk Detection: Identification of negative float and scheduling quality issues requiring attention.
Data Export: CSV and JSON export capabilities for sharing activity records and calculated results.
The demonstration showcases how automated schedule analysis can support faster project reviews, clearer performance reporting, and more informed project controls decisions.
0
20



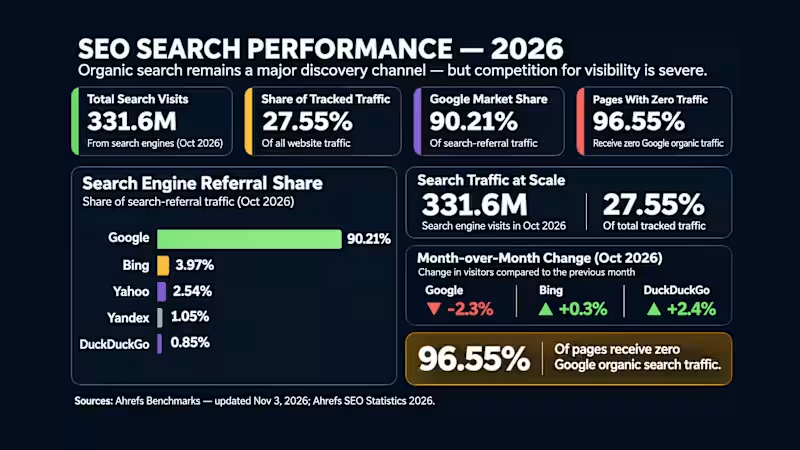
This project examines how difficult it has become for individual pages to earn meaningful organic search traffic.
Ahrefs’ research found that 96.55% of pages in its index receive no organic traffic from Google. Its October 2026 benchmark also recorded a 2.3% month-over-month decline in Google-referred visitors across more than 118,000 tracked websites, while search behavior continues to spread across traditional engines and emerging AI discovery channels.
The dashboard brings those signals together to show the scale of the visibility challenge: publishing content is not enough. Pages still need clear search intent, useful information, strong technical foundations, authority, and discoverability.
The takeaway is not that SEO is disappearing. It is that volume alone is a weak strategy. Businesses need fewer low-value pages and more authoritative, well-structured content that search engines and AI systems can discover, understand, and surface.
#SEO #SearchEngineOptimization #DataAnalytics #ContentStrategy #DigitalMarketing
1
94
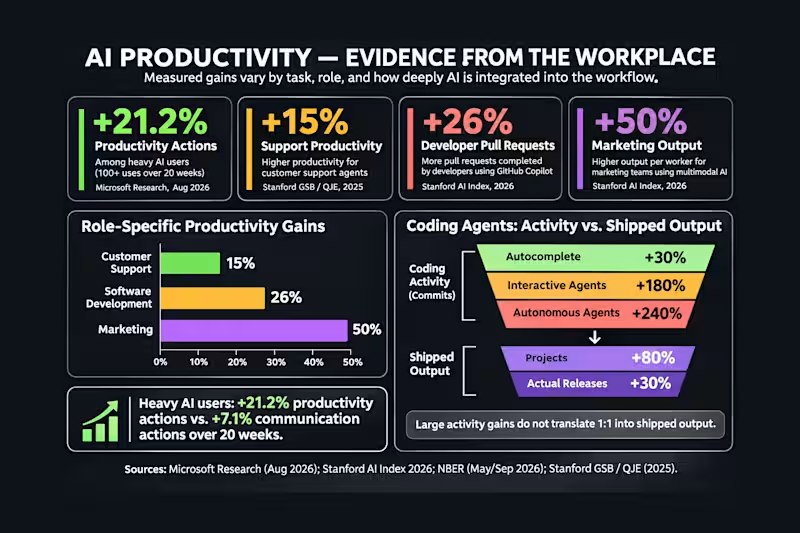
This project examines the gap between rising AI activity and measurable business output.
The research shows significant gains in AI-assisted activity across software development, marketing, customer support, and knowledge work. But increased activity does not always translate proportionally into finished output. For example, autonomous coding activity can rise dramatically while actual software releases increase at a much slower rate.
The dashboard was designed to make that gap visible and show where the real operational challenge begins: review, testing, deployment, system integration, governance, and human decision-making.
The central takeaway is simple: AI productivity should not be measured by how much activity it generates, but by how much finished value reaches the business.
1
79