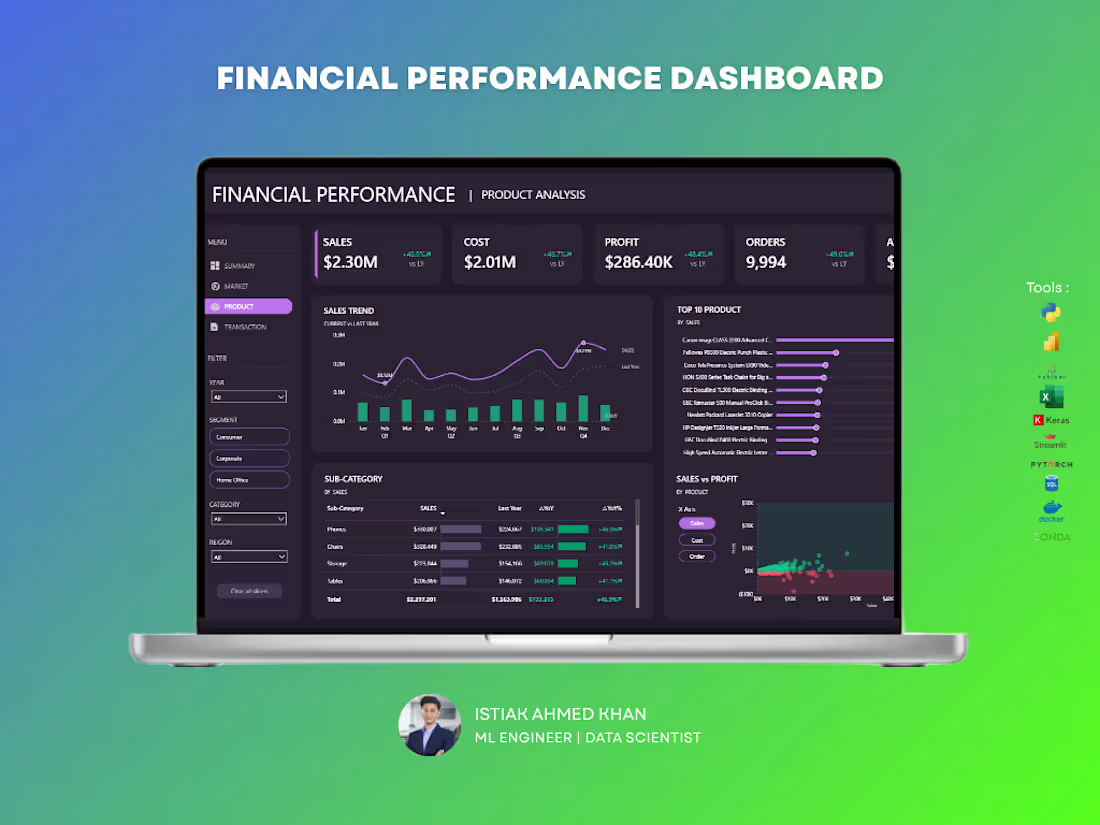
The Financial Performance Dashboard provides a comprehensive overview of an organization’s financial health by tracking revenue, expenses, profitability, and key financial indicators. Built using Power BI, this dashboard enables finance teams and decision-makers to monitor performance, identify trends, and make data-driven strategic decisions.
6
1.2K
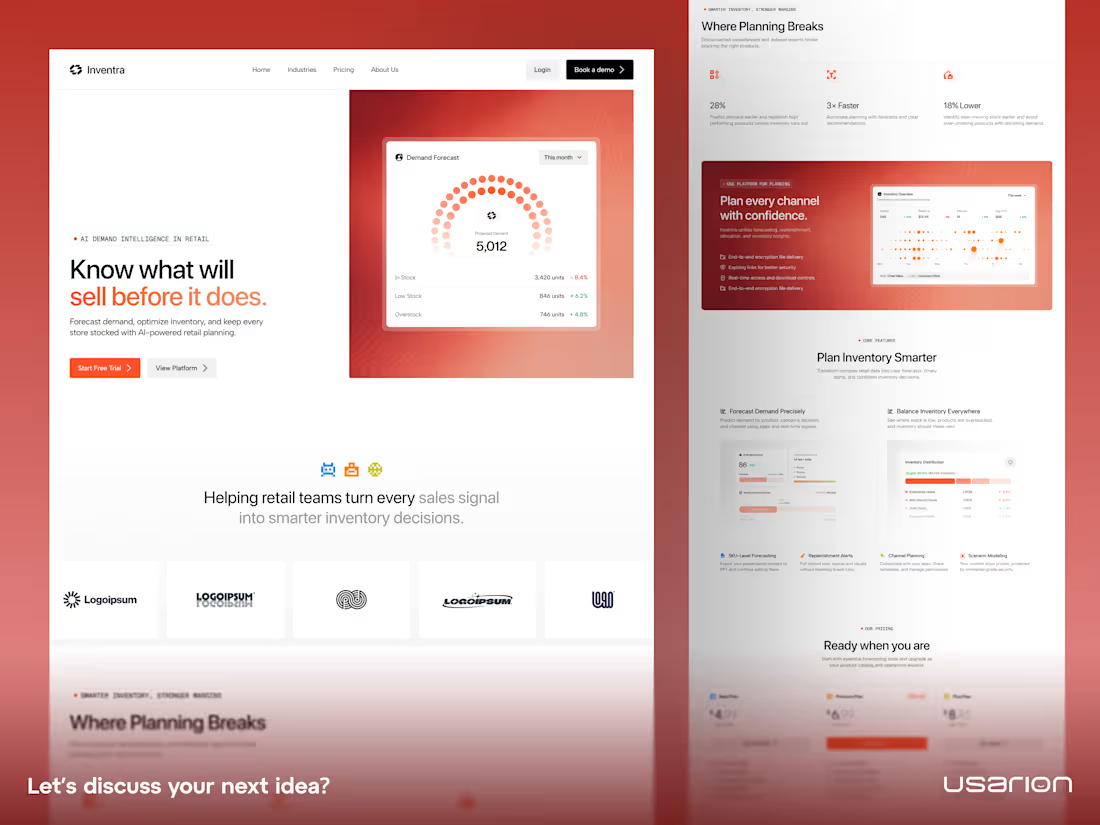
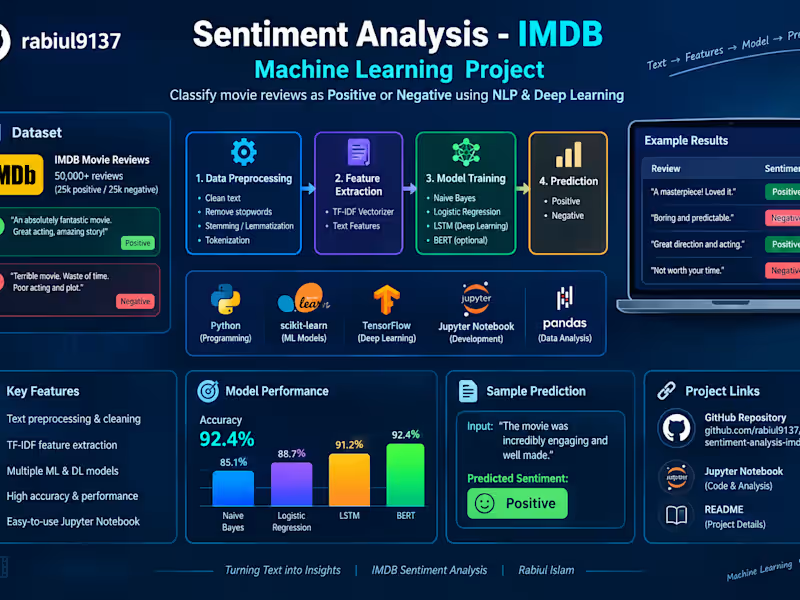
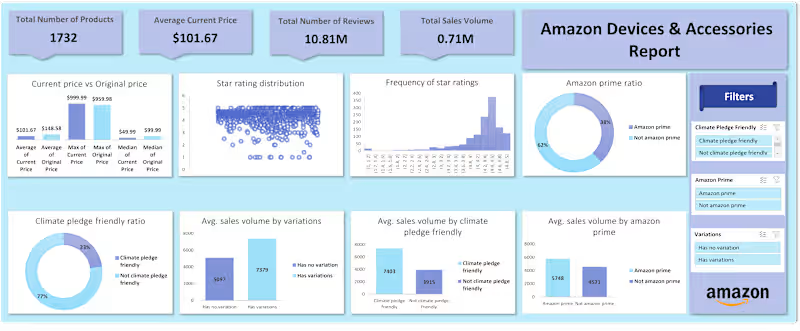




This Project Overview Dashboard provides a comprehensive view of project performance, financial outcomes, and operational progress across the organization. Built using Power BI, this dashboard enables project managers and executives to monitor key project metrics, evaluate cost efficiency, and track overall project status in real time.
Key KPIs Tracked:
✔ Total Projects – Number of active and completed projects
✔ Project Cost – Total investment allocated across projects
✔ Project Benefit – Estimated value or return generated from projects
✔ Net Benefit – Difference between project benefit and cost
✔ Average Completion Rate – Overall project progress percentage
5
13
1.5K


The Sales Segment Analysis Dashboard provides a detailed overview of sales performance across different customer segments, geographic regions, and time periods. Built using Power BI, this dashboard enables business leaders and sales teams to monitor revenue distribution, analyze customer segments, and identify high-performing markets.
Key KPIs Tracked:
✔ Consumer Sales – Total revenue generated from individual customers
✔ Corporate Sales – Revenue from enterprise and corporate clients
✔ Home Office Sales – Sales generated from home office customers
✔ Small Business Sales – Performance of small business customer segment
2
5
943

The Financial Performance Analysis Dashboard provides a comprehensive overview of an organization’s financial health by analyzing revenue, expenses, profitability, and key financial ratios. Developed using Power BI, this dashboard enables finance teams and decision-makers to monitor business performance, track profitability trends, and evaluate financial efficiency in real time.
Key KPIs Tracked
✔ Revenue – Total income generated from business operations
✔ Expenses – Combined operational and non-operational costs
✔ Gross Profit – Revenue remaining after cost of goods sold (COGS)
✔ EBIT – Earnings before interest and taxes, indicating operational profitability
✔ Net Profit – Final profit after all expenses, interest, and taxes
4
5
1K
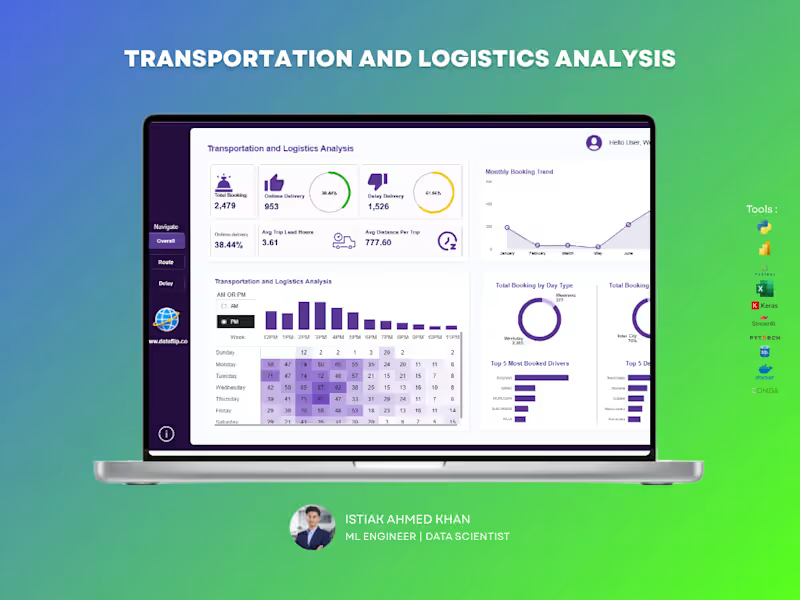
Managing logistics operations without clear insights can lead to delays, inefficiencies, and lost revenue. This dashboard is built to give you complete visibility into your transportation performance — all in one place.
A powerful analytics solution that helps you track bookings, delivery performance, delays, and operational efficiency in real time. Designed for clarity and speed, so you can make decisions without digging through raw data.
🔹Monitor on-time vs delayed deliveries instantly
🔹Track booking trends and operational workload over time
🔹Analyze trip efficiency with lead time and distance metrics
🔹Identify peak hours and demand patterns
🔹Evaluate top drivers and most frequent routes/destinations
🔹Compare weekday vs weekend performance
If you want a clean, professional dashboard that turns your logistics data into real operational insights, I can build a custom solution tailored to your business needs.
2
7
355