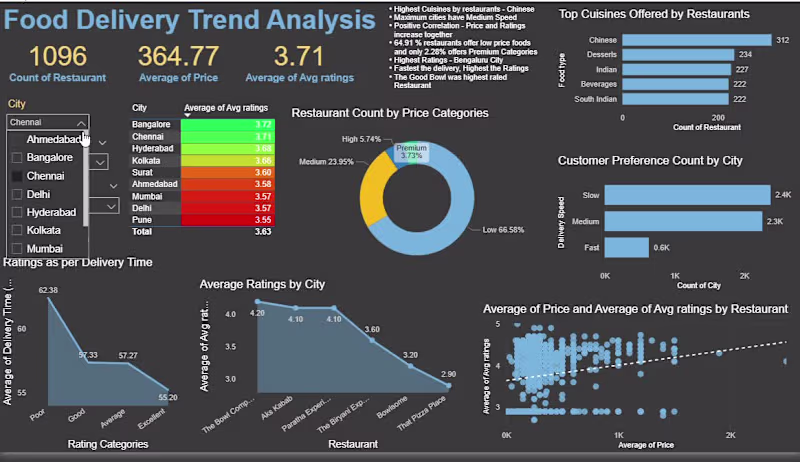
Aspiring Data Analyst | Exploring Visualization projects
Aspiring Data Analyst | Exploring Visualization projects

View more →
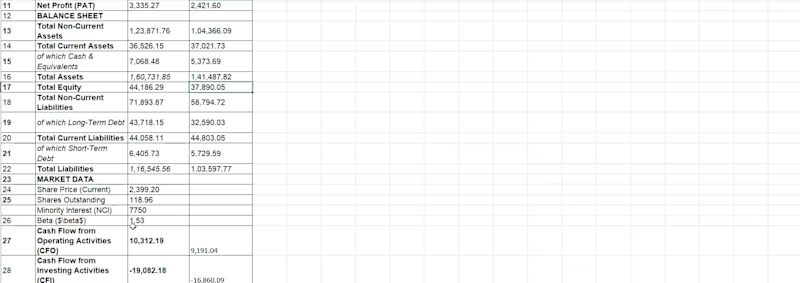
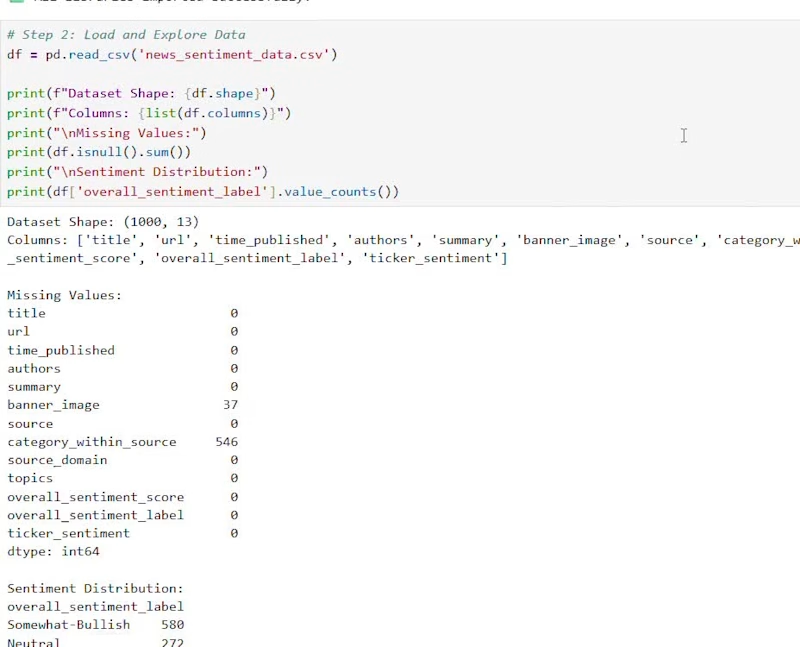
Finance & Analytics | Python Automation & Power BI
Your expert full-stack web development partner
Your expert full-stack web development partner