The network for creativity
Join 1.25M professional creatives like you
Connect with clients, get discovered, and run your business 100% commission-free
Creatives on Contra have earned over $150M and we are just getting started
Back to feedPost
Role: Data Visualization Lead
Description: Led a 4-member team at Infosys Springboard to transform 10,000+ rows of raw consumer data into an interactive sentiment-tracking dashboard. By unpivoting datasets and creating custom DAX measures, I identified a 25% surge in negative feedback related to product packaging, providing actionable insights for R&D.
Tools: Power BI, Power Query, DAX, Excel.
Impact: Awarded "Best Project" (1 of 6) for technical depth and business relevance.
Data VisualizationMicrosoft Power BIBusiness AnalysisData AnalysisMicrosoft ExcelMicrosoft PowerPoint
The network for creativity
Join 1.25M professional creatives like you
Connect with clients, get discovered, and run your business 100% commission-free
Creatives on Contra have earned over $150M and we are just getting started
Related posts
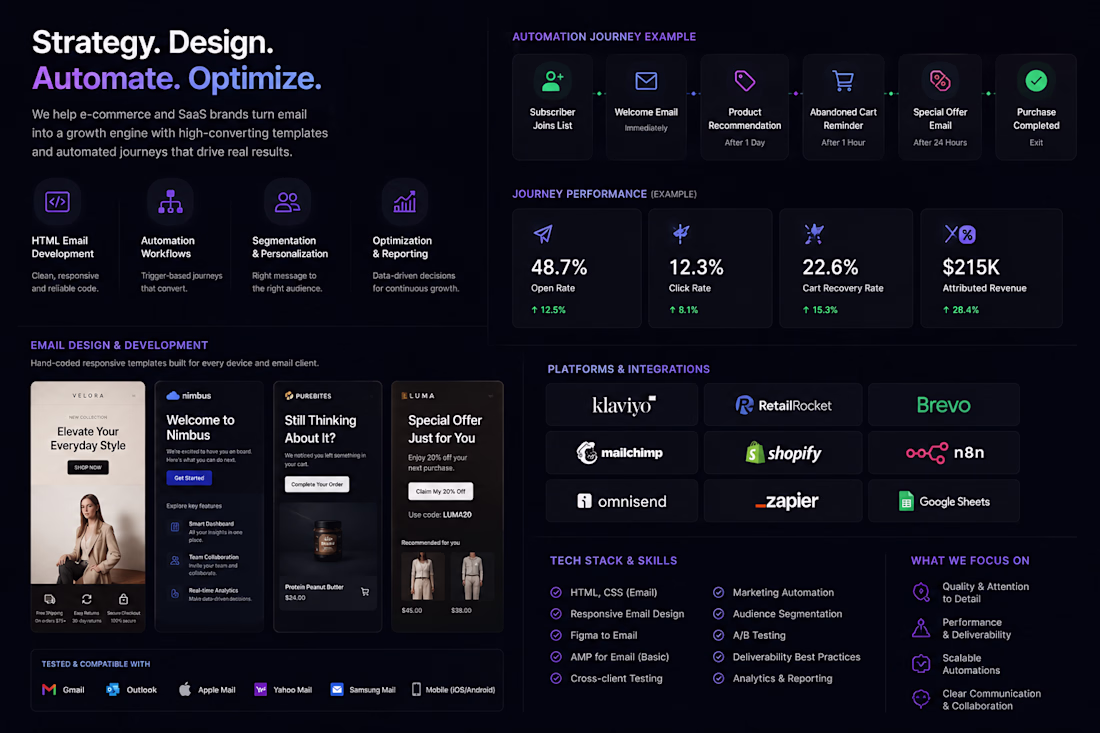
Email Marketing Automation Systems for E-commerce & SaaS Growth
This presenting a complete email marketing system for e-commerce and SaaS brands. This work demonstrates responsive HTML email development, automated customer journeys, segmentation logic, campaign optimization, and performance-focused reporting.
The visual highlights the full workflow from strategy and design to automation and analytics, including welcome emails, product recommendations, abandoned cart recovery, special offer campaigns, and purchase completion flows. It also shows platform experience across Klaviyo, Retail Rocket, Brevo, Mailchimp, Shopify, Omnisend, Zapier, n8n, and Google Sheets.
The goal of this portfolio piece is to show how our team builds clean, scalable, and conversion-focused email systems that improve engagement, recover revenue, and support long-term customer retention.
Nice 👍
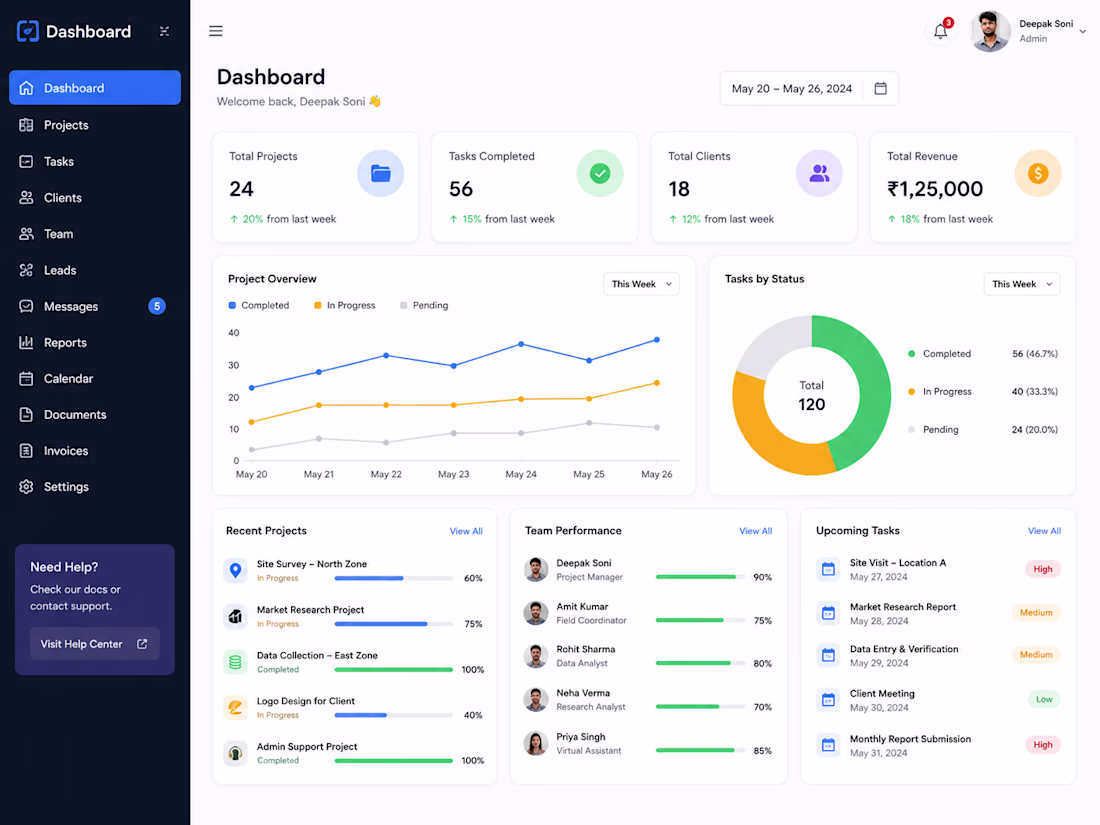
📊 Transform Your Business Data into Actionable Insights
Most businesses collect plenty of data—but very few use it effectively.
Raw spreadsheets don't help you make faster decisions. A well-designed dashboard does.
I help businesses turn complex data into interactive, easy-to-understand dashboards using:
📊 Power BI
📈 Microsoft Excel
📉 Looker Studio
Whether it's Sales Analytics, Financial Reporting, KPI Tracking, Marketing Performance, HR Analytics, or Business Intelligence, my goal is to create dashboards that help decision-makers understand their data at a glance.
In my latest service video, I showcase how I design clean, modern dashboards that are both visually appealing and business-focused.
If you're looking for a custom dashboard or want to improve your business reporting, I'd be happy to discuss your project.
📩 Feel free to connect or send me a message.
#PowerBI #DataAnalytics #BusinessIntelligence #Dashboard #DataVisualization #MicrosoftExcel #LookerStudio #SQL #BusinessAnalytics #KPIs #Reporting #DataDriven #Analytics #BusinessReporting #Freelancer
Trending
Claude
Claude has entered the design space. How are you using Claude Design?
Contra University
Learn from expert creatives how to earn more using next-gen AI tools.
fifaworldcup2026
The World Cup is here and the whole world's watching. How are you designing for the world stage?
creativeaiflow
Creative AI workflows are evolving. What tools do you use, and what are their strengths and weaknesses?
freelancerlife
Freelancer life is wins, pivots, and everything in between. What’s yours right now?