


Built an AI-powered content hub for Instagram creators and agencies managing reach, engagement, scheduling, and DM leads across multiple accounts from one clean dashboard.
Aifluencee tracks real-time metrics (reach, engagement rate, watch time, saves, shares), generates scripts with AI, benchmarks competitors, and surfaces weekly performance reports so creators spend less time analyzing and more time creating.
From multi-account Instagram connect to automated content scheduling and DM-to-lead tracking, every feature is designed around one goal: turning content into clients.
0
181

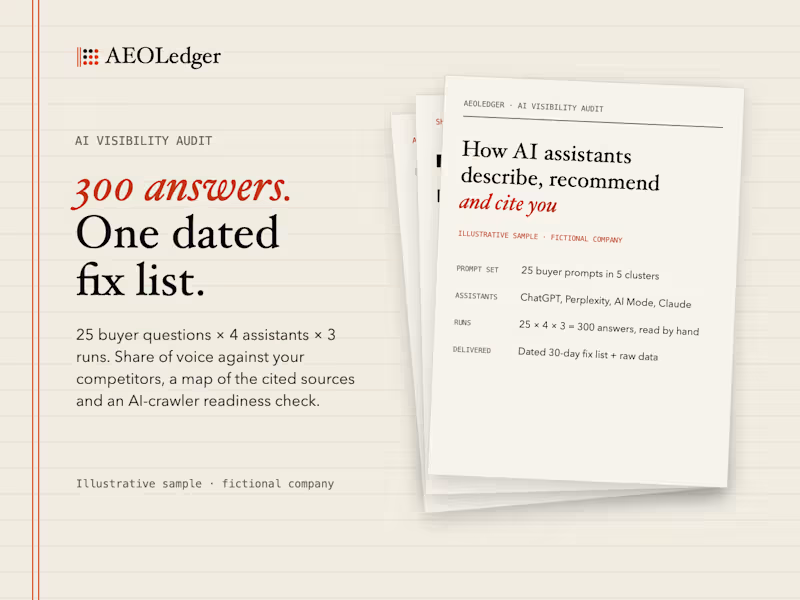
AI Visibility Audit: 25 buyer questions × ChatGPT, Perplexity, Google AI Mode and Claude × 3 runs = 300 answers, read by hand. Share of voice against up to 5 competitors, a map of the cited sources, a check of what AI crawlers can read, and a dated 30-day fix list with the raw data. The card shows an illustrative sample for a fictional company; the sample report PDF is linked on aeoledger.com/pricing/
0
16
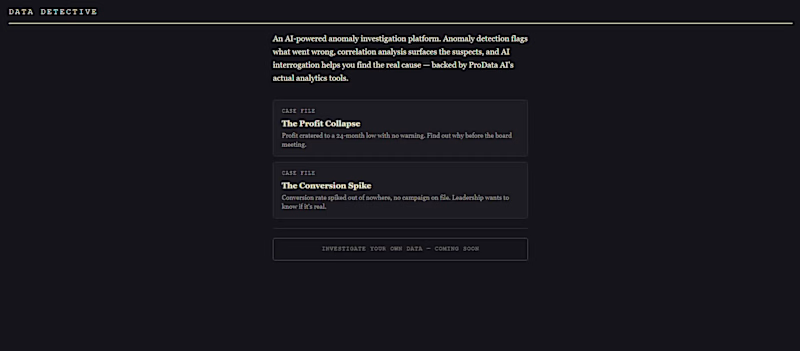
Built something I'm pretty proud of — Data Detective
An AI-powered anomaly investigation tool that turns dry data analysis into a noir detective case.
Under the hood:
→ Claude + 14 custom MCP tools
→ Isolation Forest for anomaly detection
→ Pearson correlation analysis
→ Results presented as an actual investigation report
No spreadsheets. No jargon. Just: "The suspect is outlier #47. Here's the evidence."
Live here → [https://claude.ai/public/artifacts/f8117dff-b531-4f31-8862-2a86a77137c2]
Full MCP server → https://github.com/Varu4/prodata-ai-mcp
#contralabs #AI #dataanalysis
2
4
403

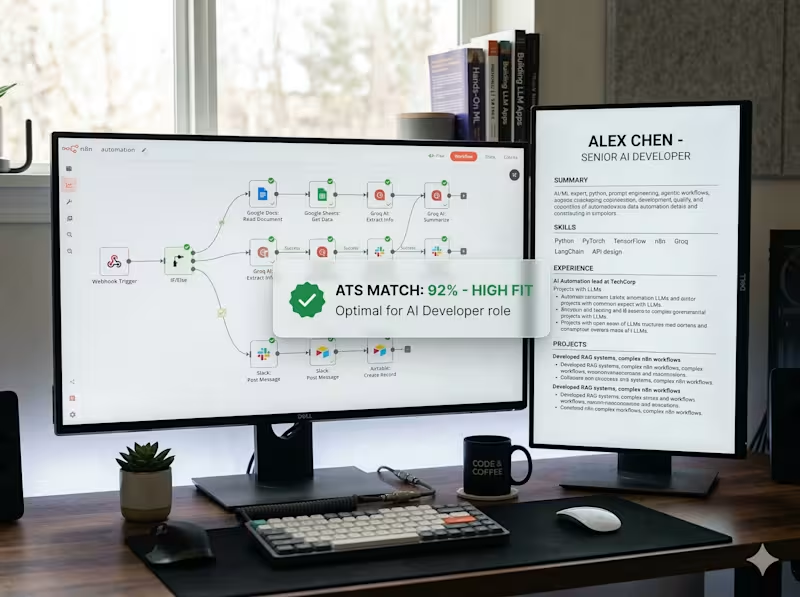
I architected an intelligent, autonomous n8n agent that manages the entire job application lifecycle. The workflow performs a real-time sweep of job boards using specialized APIs and automatically loops over every result. It sends the Master Resume of an M.Tech (http://M.Tech) in Data Science from NIT Trichy and the target Job Description into a Groq-powered AI model for optimization.
When the AI identifies a strong lead (Score > 60%), it triggers a multi-step Update loop. The agent surgically injects aligned bullet points into a native Google Doc and applies a high-precision JavaScript cleanup to remove messy technical formatting. This ensures the finalized resume is perfectly aligned and looks like it was manually crafted by a top-tier professional, ready to achieve a 92%+ ATS match score.
0
62



Economic Intelligence Dashboard: Predictive Modeling & Real-Time Visualization:
Architected a high-fidelity full-stack platform designed to aggregate and visualize macroeconomic indicators from the World Bank Open Data API. This project combines live data orchestration with machine learning to provide predictive insights into global GDP, inflation, and labor trends.
Technical Deep-Dive:
Data Pipeline: Engineered a Python/Flask backend to normalize and serve real-time macroeconomic data, ensuring consistent data structures across diverse international sources.
Predictive Analytics: Implemented a regression-based forecasting tool that utilizes historical time-series data to project future GDP growth with interactive user-input variables.
Geospatial & Statistical UI: Developed a responsive frontend using React and Leaflet.js, featuring dynamic map hotspots and complex statistical overlays using Plotly.
Insight-Driven Design: Optimized the platform for data storytelling, allowing users to reveal hidden correlations between variables like inflation and unemployment through interactive scatter plots.
0
68
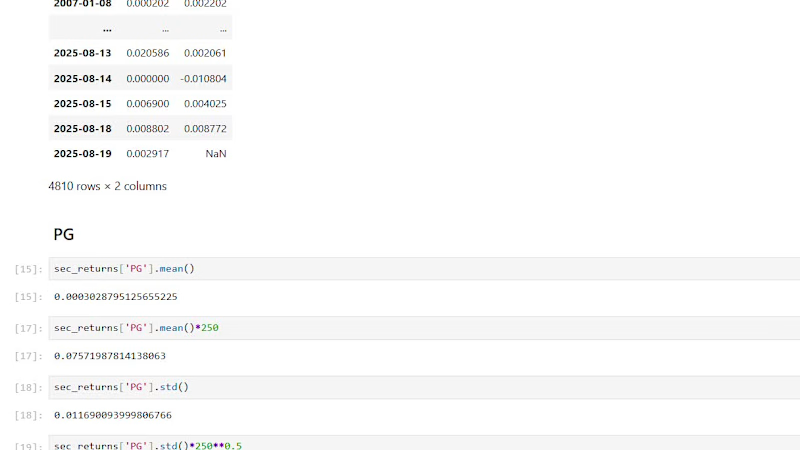
Role: Quantitative Developer
Description: Built a custom Python toolkit designed for automated stock return analysis and risk-reward plotting. This project streamlines the portfolio management process by visualizing technical indicators and identifying optimal entry/exit points based on historical data.
Tools: Python, Matplotlib, SQL.
Impact: Automated the generation of technical reports, replacing 4+ hours of manual spreadsheet work.
0
51

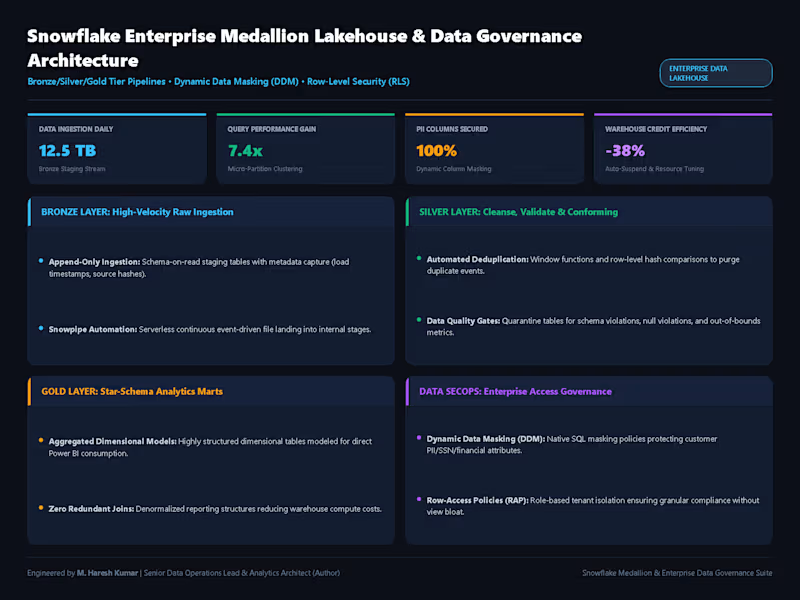
Production enterprise Medallion Lakehouse architecture (Bronze/Silver/Gold) on Snowflake. Features automated schema validation, deduplication data quality gates, micro-partition clustering for 7.4x query acceleration, and native SQL Dynamic Data Masking (DDM) with Row-Access Policies (RAP) for enterprise compliance and secure Power BI consumption.
0
22