Project Finance Tracker Dashboard
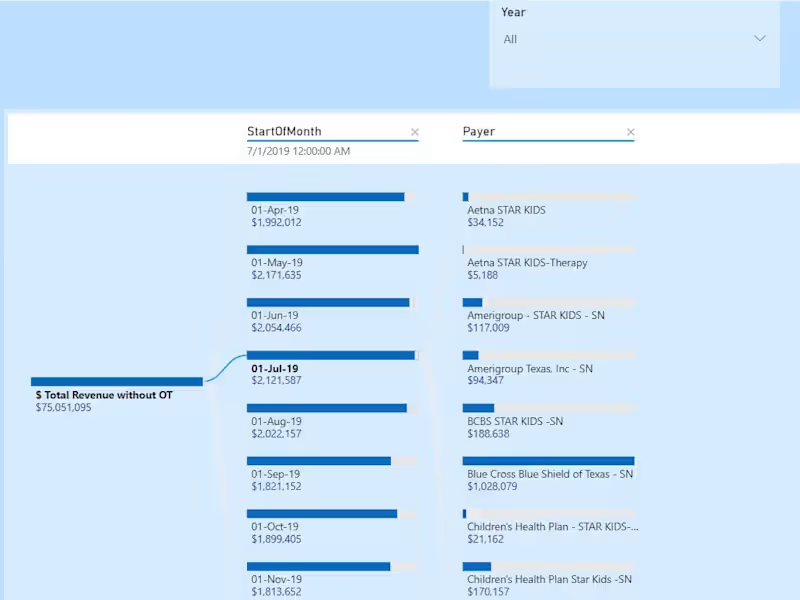
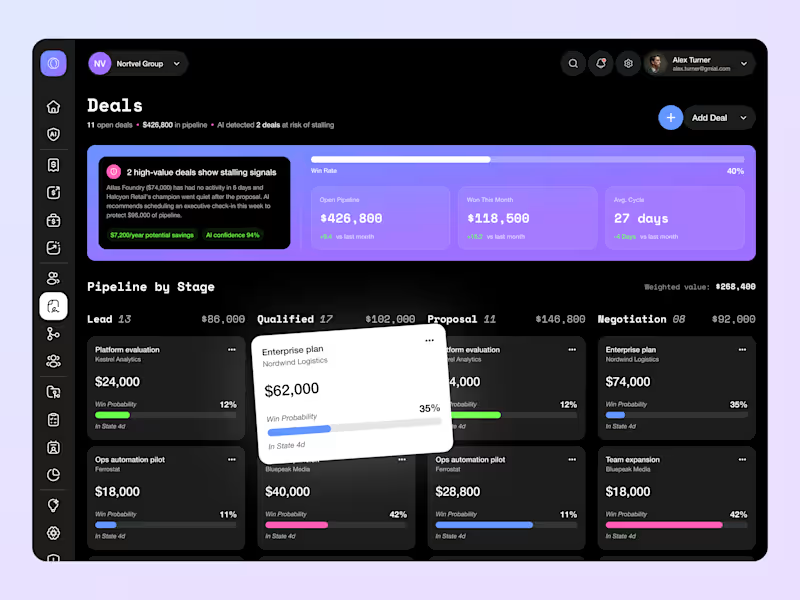
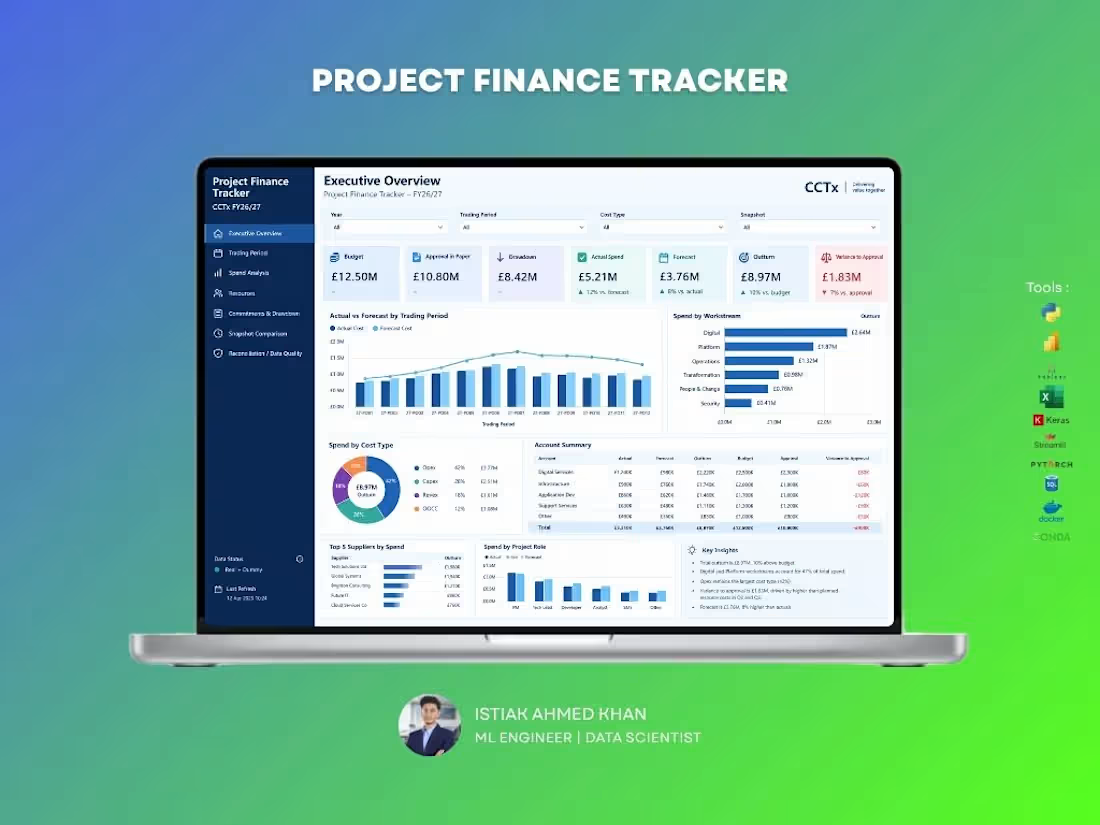
A comprehensive dashboard designed to help project teams monitor budgets, actual spending, forecasts, commitments, and financial variances in one place. Track performance by trading period, cost type, workstream, supplier, and project role. Identify overspending, forecast gaps, and approval requirements early to improve financial control, reporting accuracy, and project decision-making.
1
83
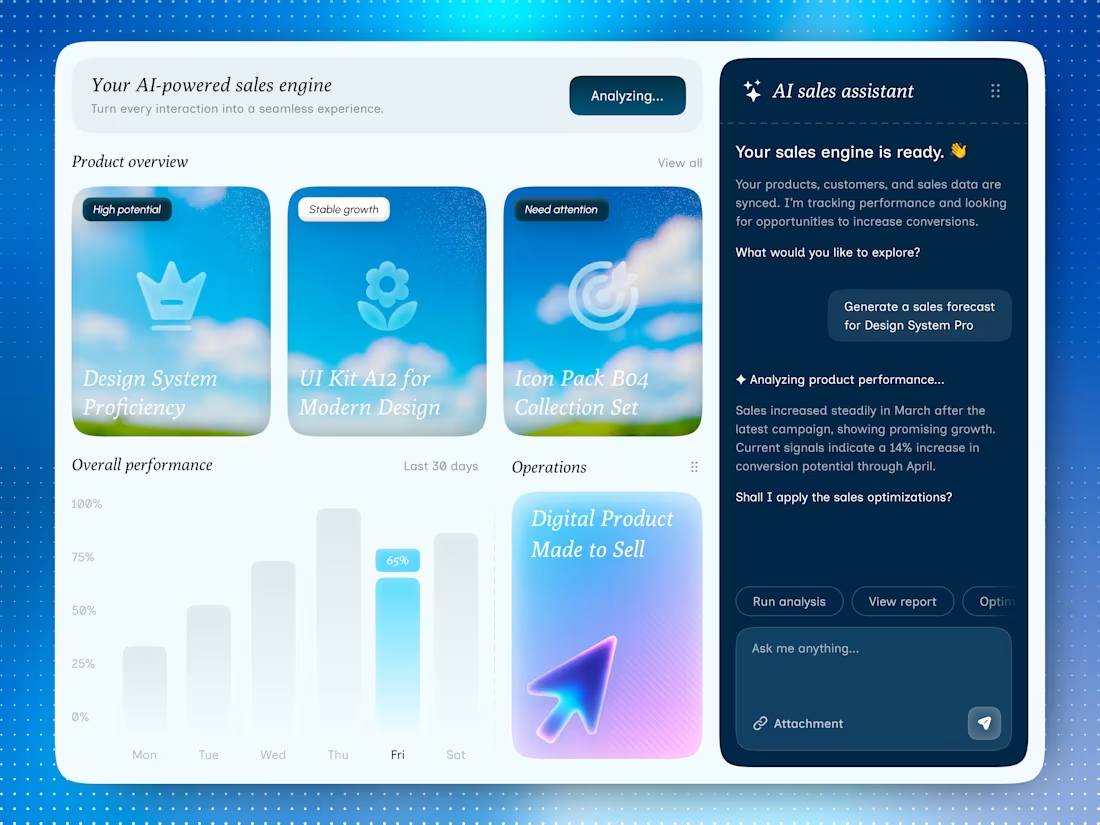
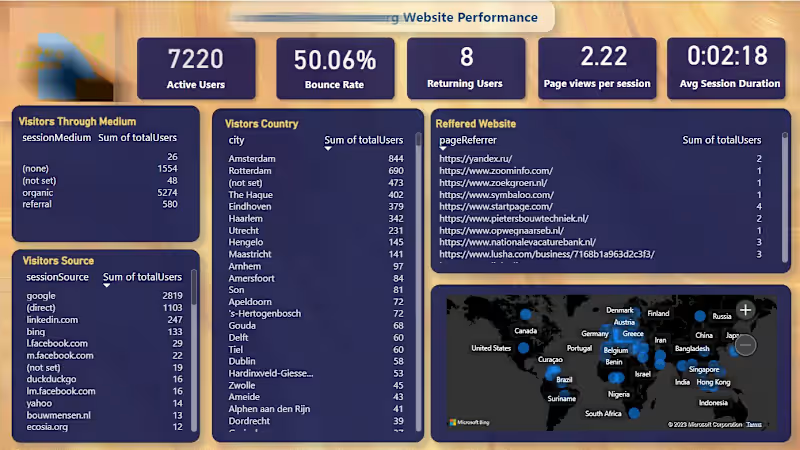
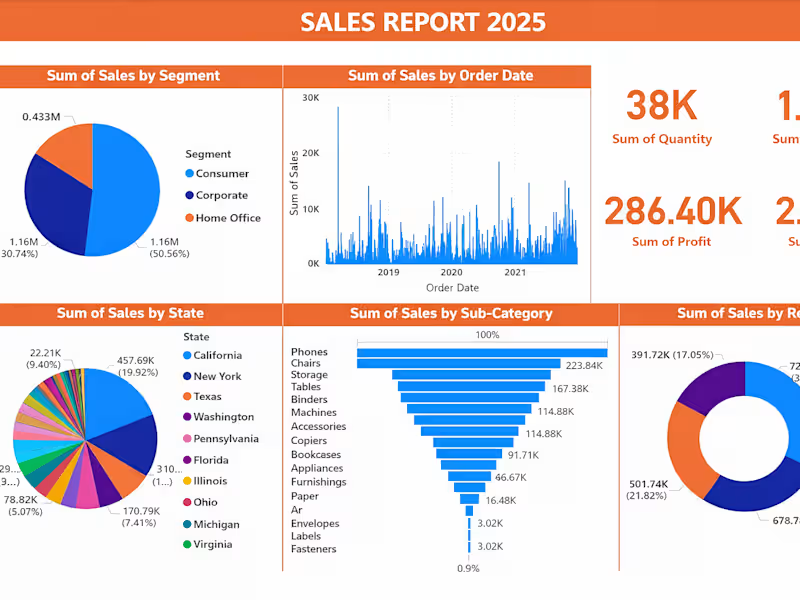
📊 AI-Powered Sales Dashboard | Project Completed
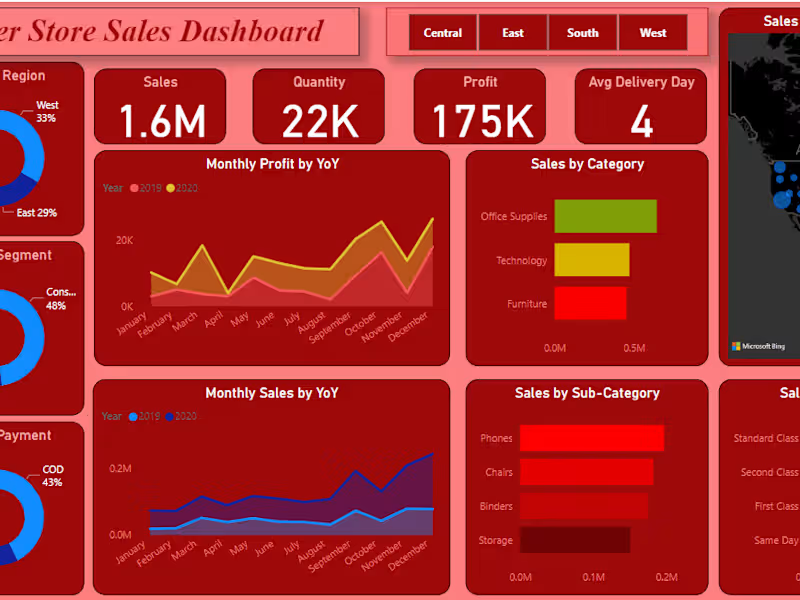
I’ve successfully completed this AI-assisted Sales Data Visualization project, transforming raw sales data into a clear, decision-ready dashboard.
✅ What this dashboard delivers:
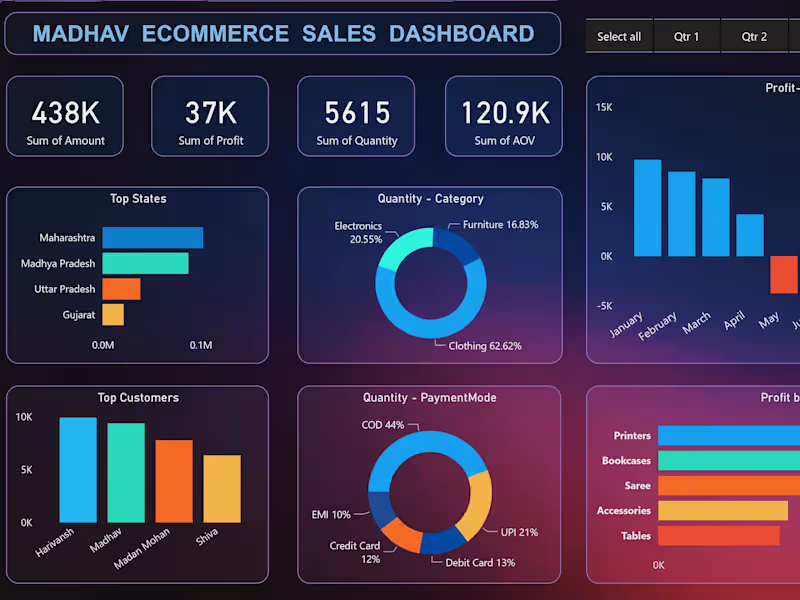
Business-focused KPIs (Sales, Profit, Quantity, Discount)
Segment, Region, State & Category-wise performance analysis
Clean, modern, client-friendly visual layout
Easy insights for fast business decisions
🧠 My Role & Skills:
Data cleaning & structuring
KPI identification & analysis
AI-assisted data visualization
Dashboard design & data storytelling
📌 This project is fully completed and ready for real-world business use.
I don’t just visualize data — I turn data into business decisions.
6
4
147

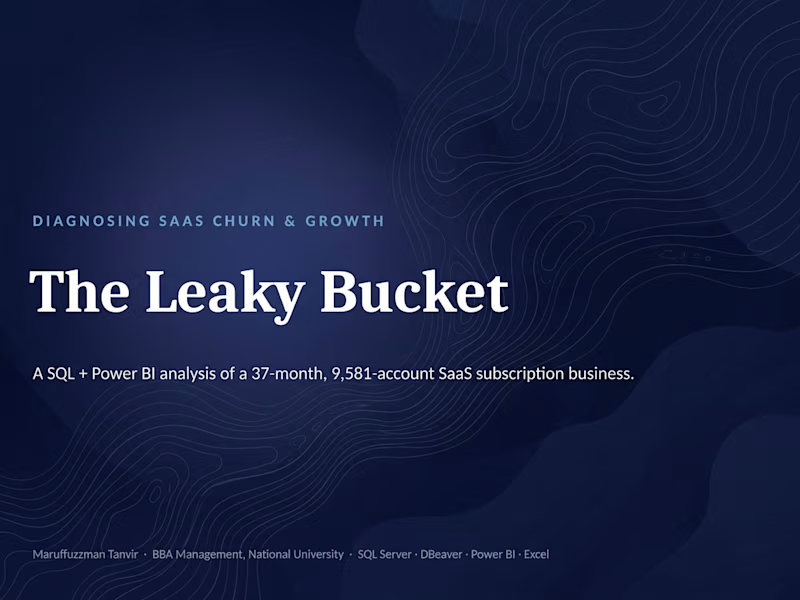

Driving Commercial Excellence at an International FMCG Leader
Working at Unilever gave me firsthand experience in how one of the world's largest multinational companies builds brands, scales operations, and drives commercial growth.
I managed BDT 1.2 billion (USD 14 million) in annual business, led 400+ sales professionals, contributed to innovation launches, and supported South Asia regional brand strategy. Today, I apply the same strategic thinking and operational discipline to help businesses grow sustainably.
0
211