
DEEPIKA SINGARAVELU
Data entry & Excel specialist helping you organize .
New to Contra
DEEPIKA is building their profile!
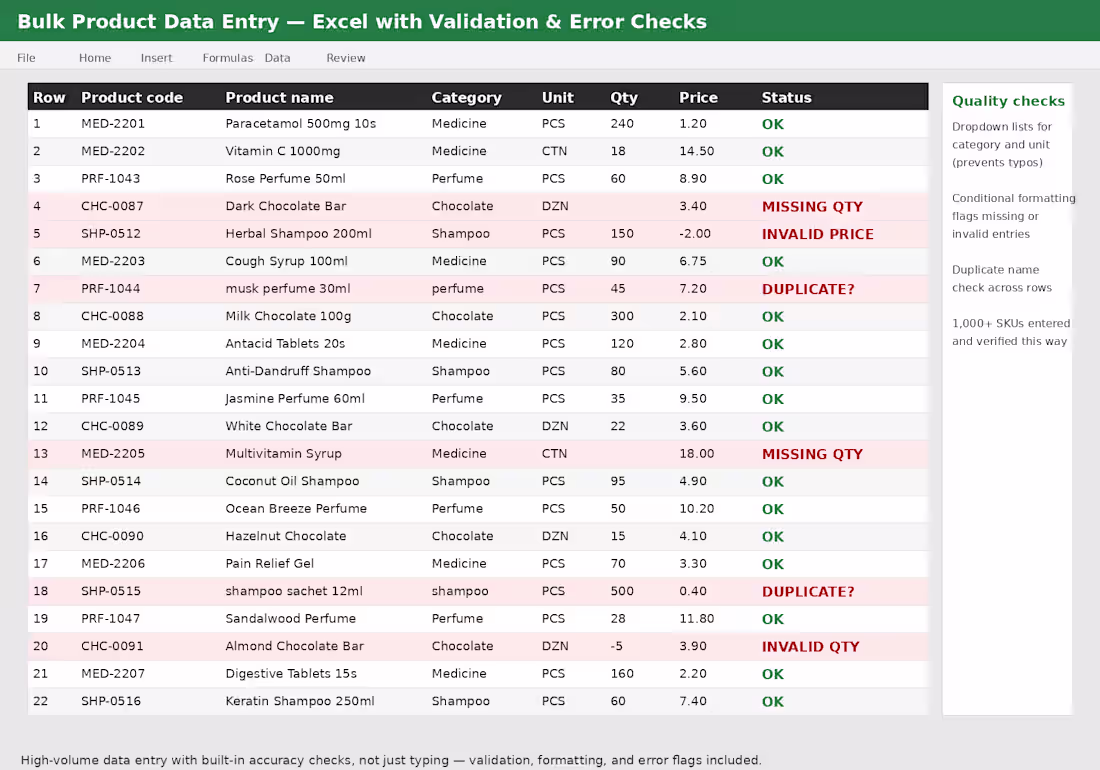
This project shows how I handle high-volume data entry for product catalogs — not just typing data in, but building accuracy checks into the sheet as I go.
What I did:
Entered 1,000+ product records across category, unit, quantity, and price fields
Set up dropdown lists for category and unit to prevent typos
Applied conditional formatting to flag missing or invalid entries
Checked for duplicate product names across rows
Delivered a clean, verified dataset ready for use
Why it matters: Large data entry jobs fail when errors go unnoticed. Building validation and error-checking into the process — not just entering data — is what makes a dataset actually usable.
0
8
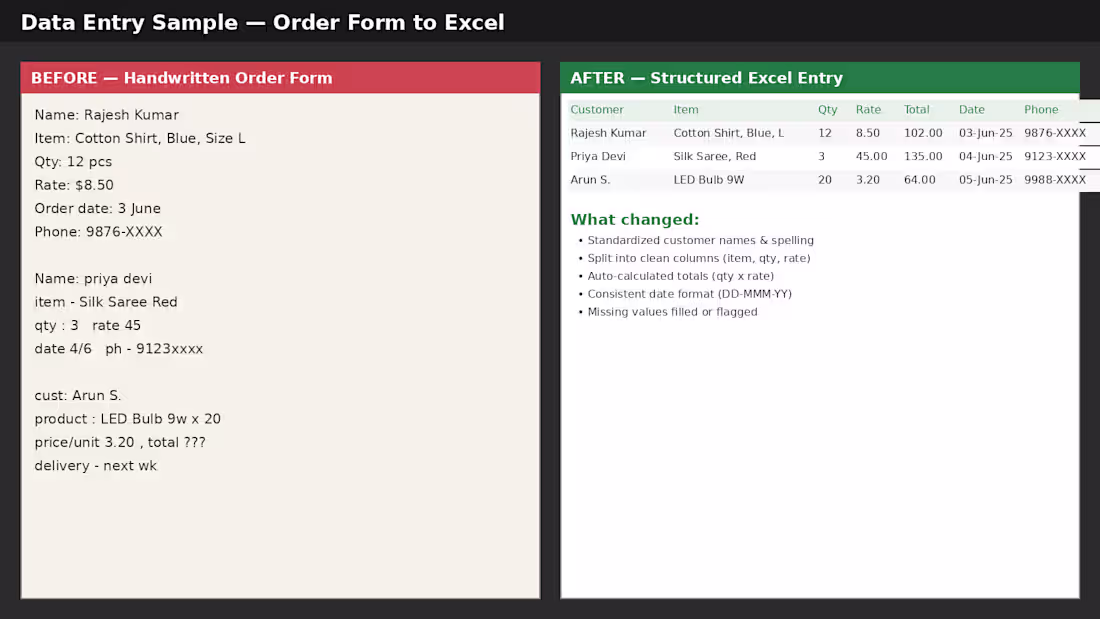
This project shows how I convert messy, handwritten order forms into clean, structured Excel data ready for reporting and analysis.
What I did:
Standardized customer names and spelling
Split raw notes into clean columns (item, quantity, rate)
Auto-calculated totals using formulas (qty × rate)
Formatted all dates consistently (DD-MMM-YY)
Flagged and filled missing values
Why it matters: Handwritten or inconsistent order data is hard to search, sort, or use for reporting. This kind of cleanup turns scattered information into a reliable dataset that's ready for invoicing, inventory tracking, or sales analysis.
I do this kind of data entry and cleanup work regularly for retail and B2B order records.
0
5
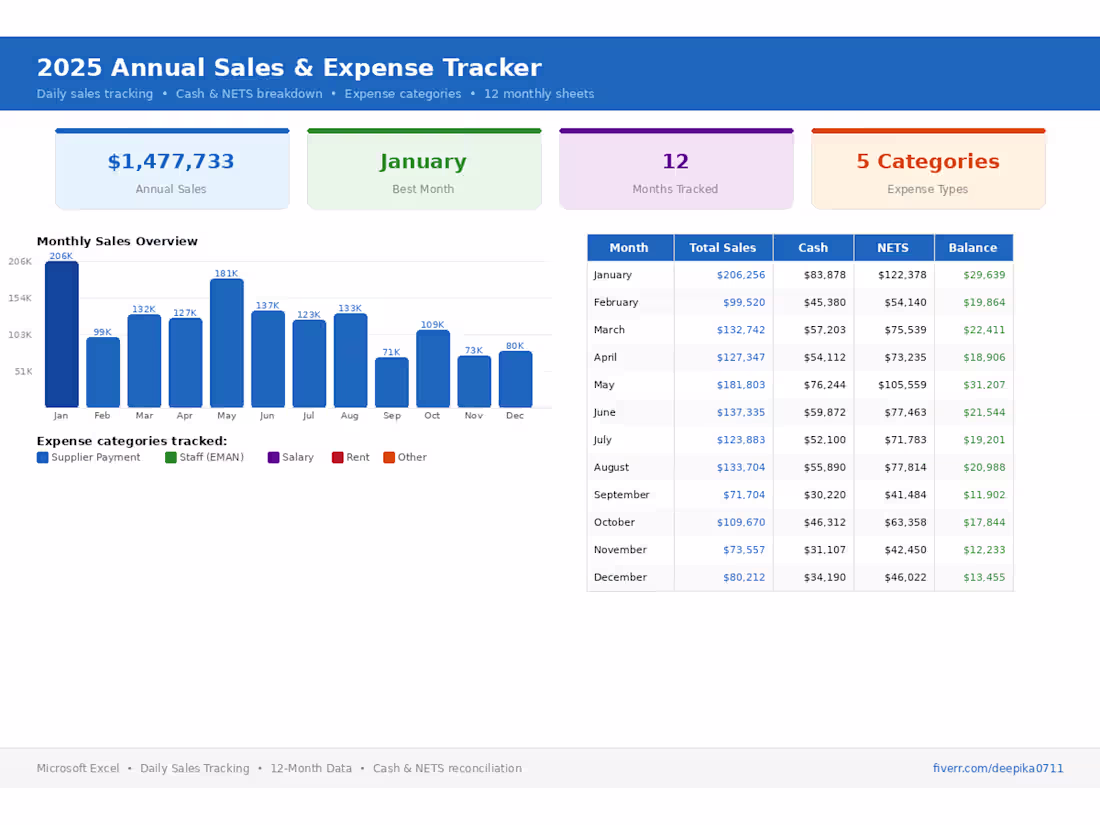
Built an interactive Annual Sales & Expense Tracker dashboard in Excel — tracks daily sales, cash vs NETS breakdown, and 5 expense categories across 12 monthly sheets. Includes auto-calculated KPIs and visual summaries for quick decision-making.
2
165
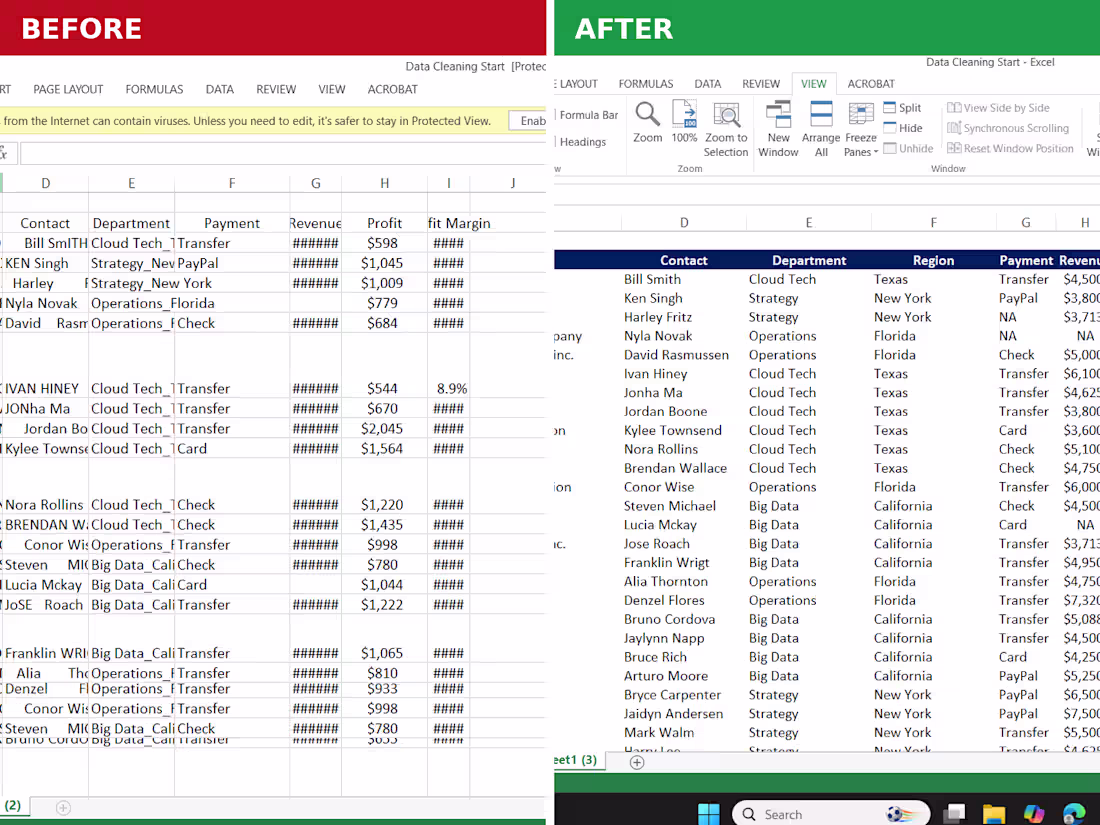
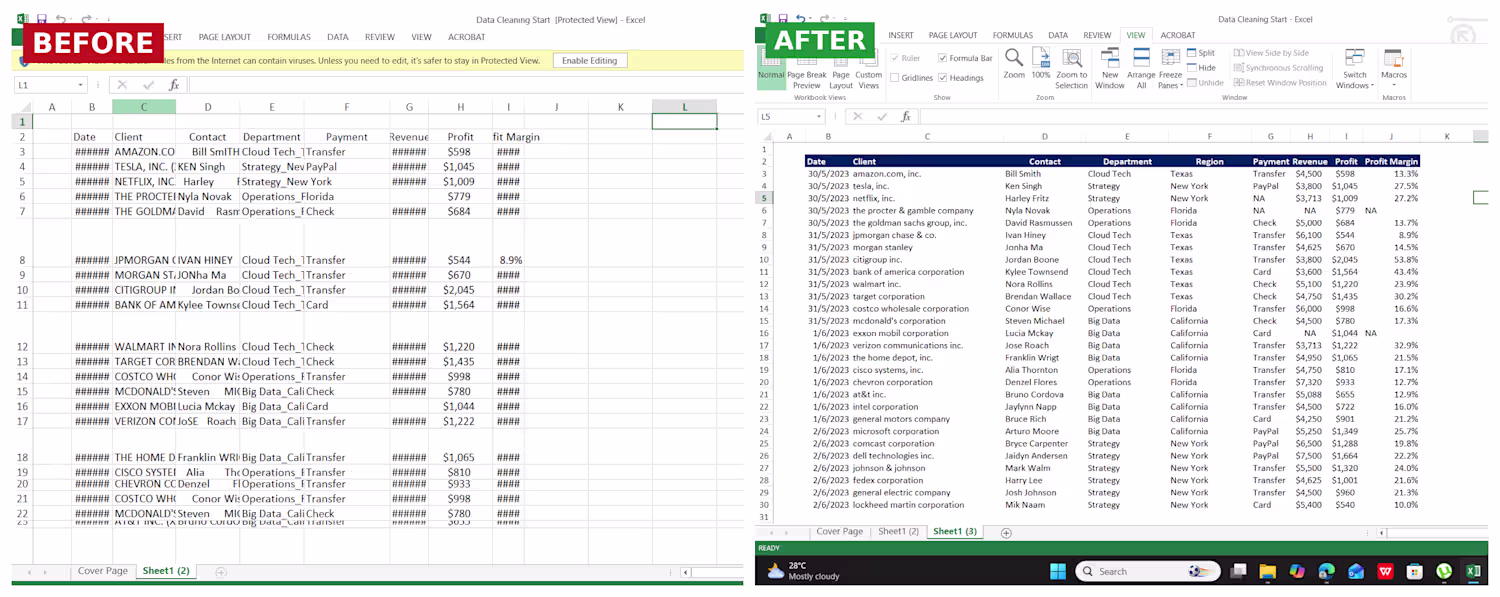
Before:
Raw transaction data — inconsistent client names, random formatting, no clear structure. Took forever to make sense of, let alone present.
After:
Clean, structured, color-coded sheet — proper headers, sorted by region & department, payment methods standardized, profit margins clearly visible.
What changed it:
Sub CleanAndFormatData()
Call StandardizeClientNames
Call SortByRegionDepartment
Call FormatHeaders
Call ApplyColorCoding
Call CalculateMargins
End Sub
⏱️ A task that used to take 1-2 hours of manual cleanup now runs in seconds.
Data cleaning is one of the most underrated VBA use cases — most people only think automation = formulas, but cleaning + structuring raw data is where it saves the most time.
Drop a 👍 if you deal with messy spreadsheets regularly — happy to share how I approach this.
2
167