
Dawood Khan
POS Data Analyst | Power Query, Power BI, Excel Dashboards
New to Contra
Dawood is ready for their next project!

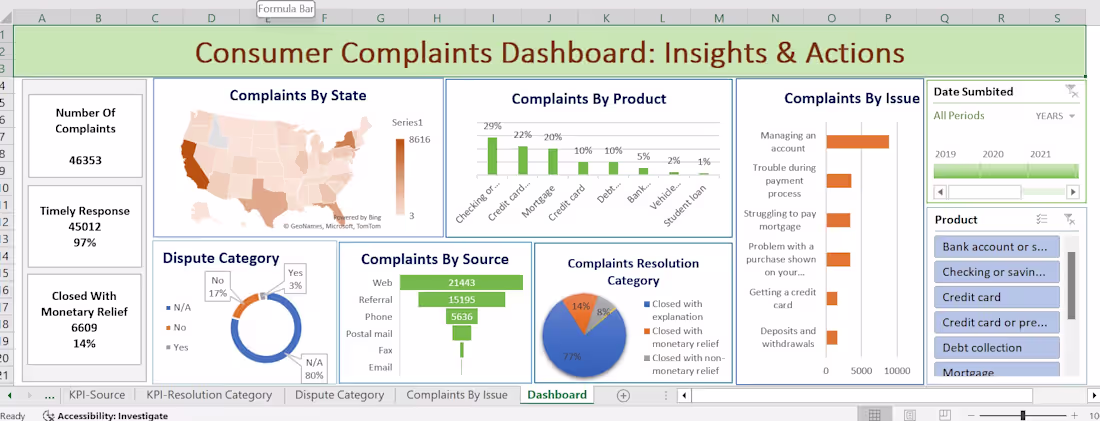
The Consumer Complaints Dashboard: Insights & Actions provides an interactive view of consumer complaints for a financial institution from 2019 to 2023. It categorizes data by state, product, issue, and includes slicers for each category plus a timeline filter. A key feature tracks complaints resolved with monetary compensation, offering insights into service response and complaint trends. This tool supports targeted improvements by allowing users to identify high-complaint areas and analyze data over time, helping the institution enhance customer satisfaction.
0
21
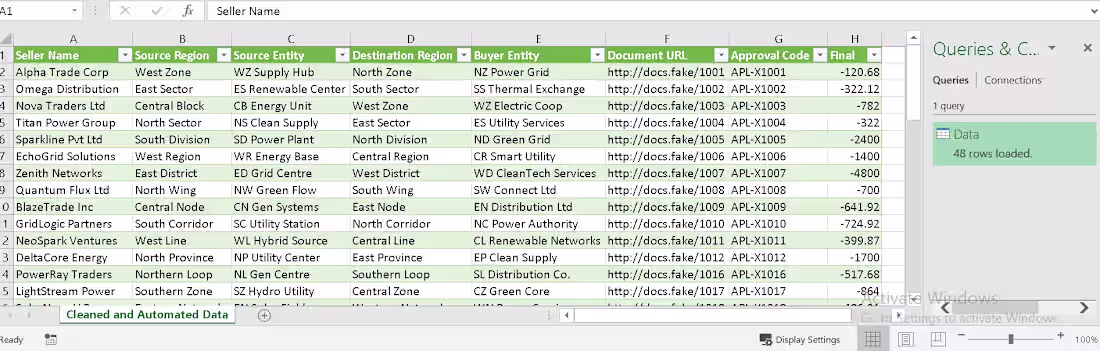
This project demonstrates how I used Excel Power Query to clean, transform, and automate multiple CSV files stored in a folder. The goal was to extract only the required rows, reshape the data, and build an automated solution that updates with a single click whenever new data is added. The raw data was stored in multiple CSV files within a folder.
0
17
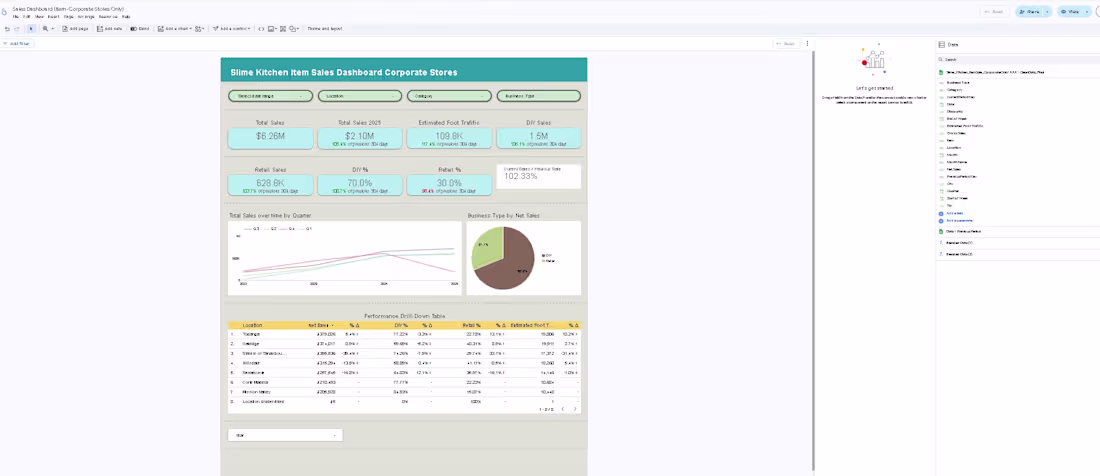
Slime Kitchen ran 14 stores across franchise and corporate ownership using two POS systems — Square and GoParrot.
I extracted, merged, and cleaned both exports using Power Query, added custom time columns, and built a fully interactive Looker studio dashboard.
The owner could — for the first time — see complete business performance in one place, updated simply by refreshing the export.
0
22
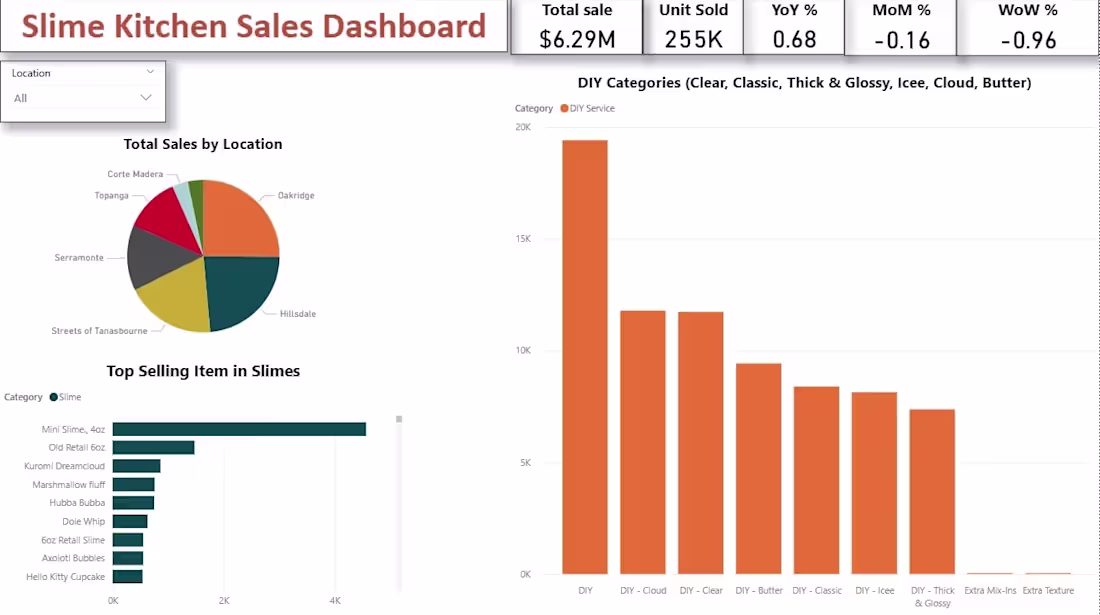
Cleaned and automated 30,000+ rows of POS data using Power Query, reducing manual reporting time by 80%. Built an interactive Power BI dashboard tracking $6.29M in sales and 255K units sold across multiple locations. Delivered KPIs (YoY, MoM, WoW) and insights into top products and locations. Enabled faster decision-making by identifying high-performing areas and revenue opportunities through clear, real-time visuals.
0
31