
Daisy Quitalig
Data Analyst | Excel | Power BI | Reporting | SQL (Learning)
New to Contra
Daisy is ready for their next project!
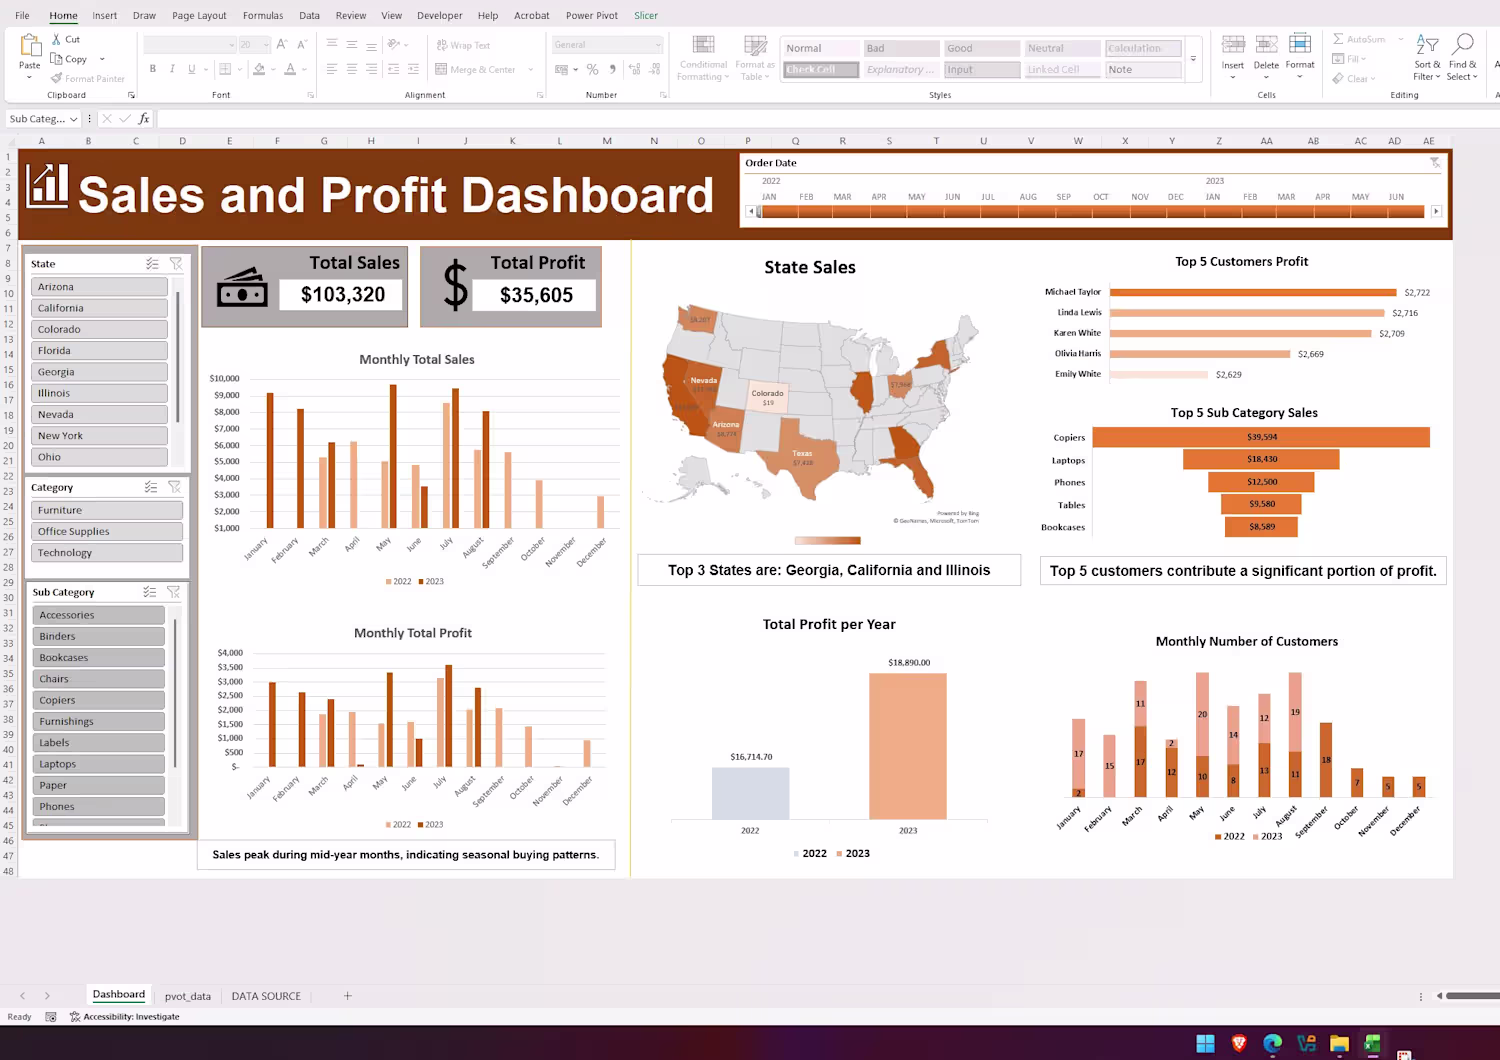

i make this using Excel and Power Query
0
5
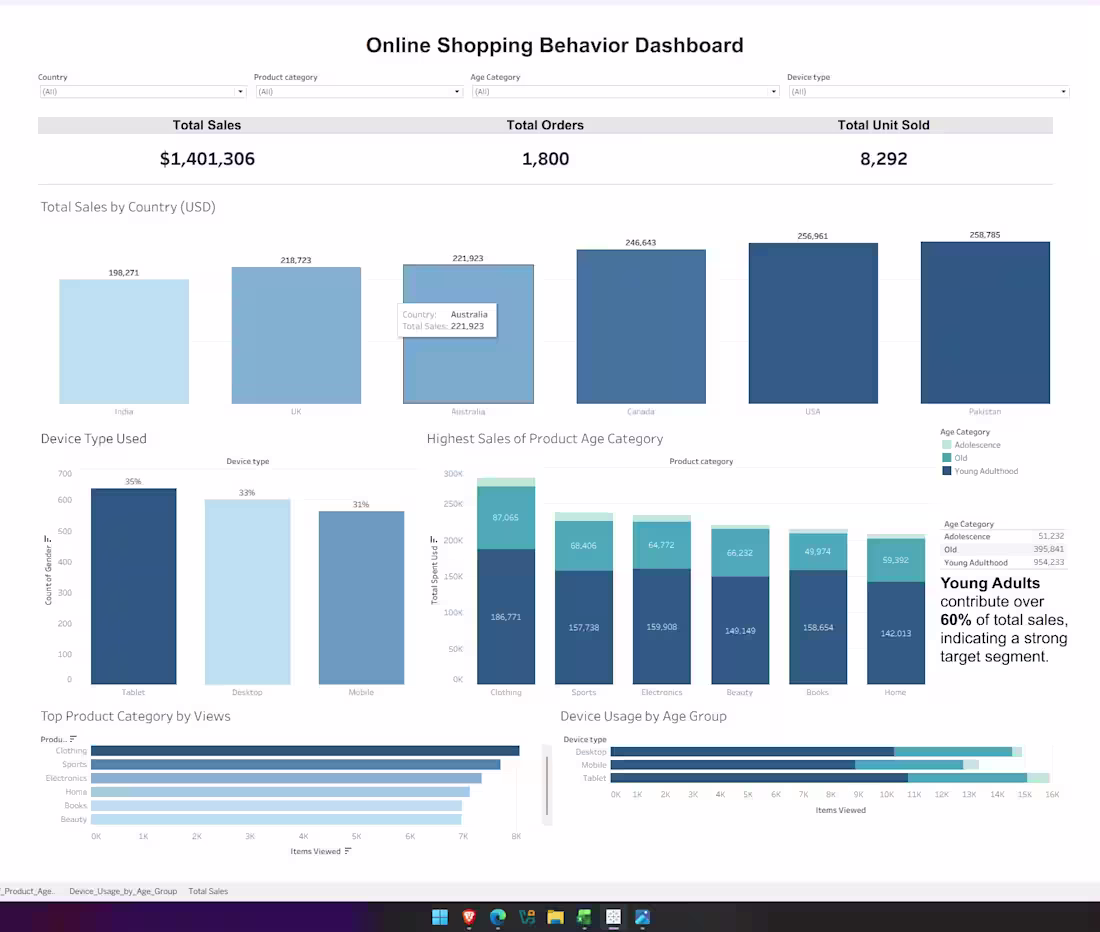
I make this dashboard via Tableau.
0
10
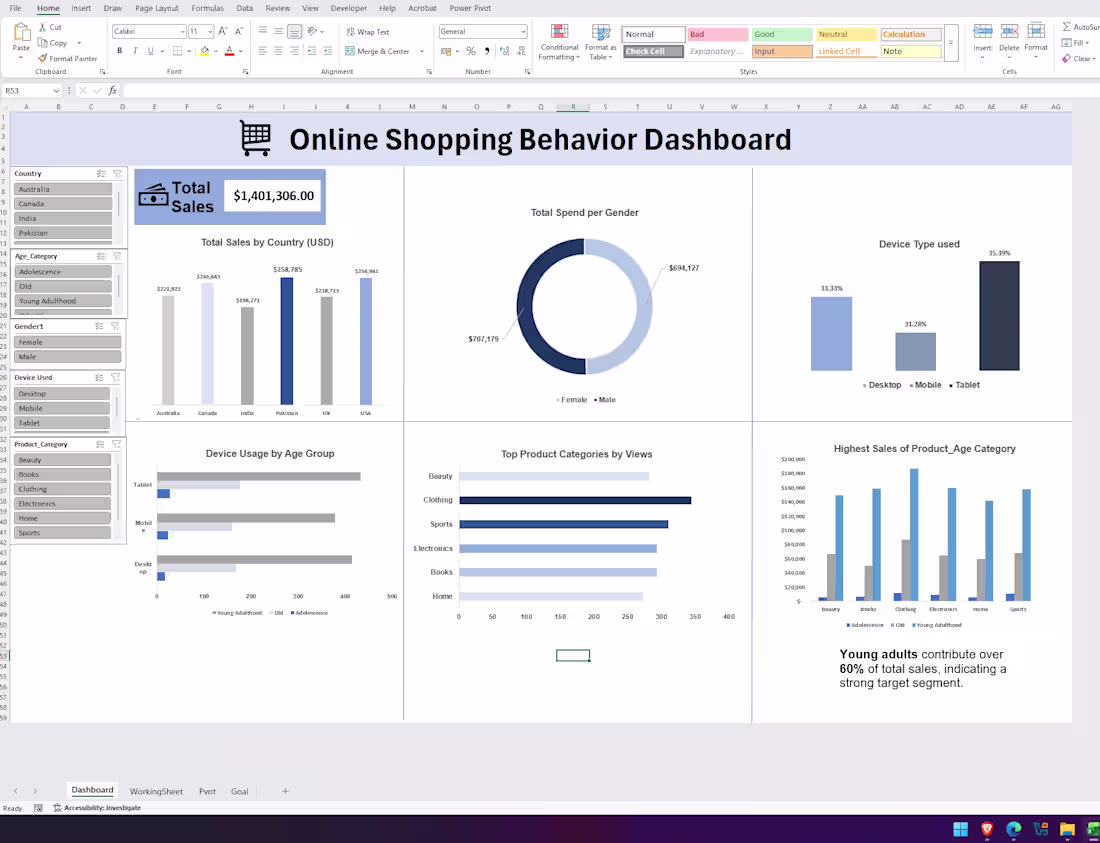
Online Shopping Behavior. Dashboard via Excel.
Dataset is from Kaggle
0
12
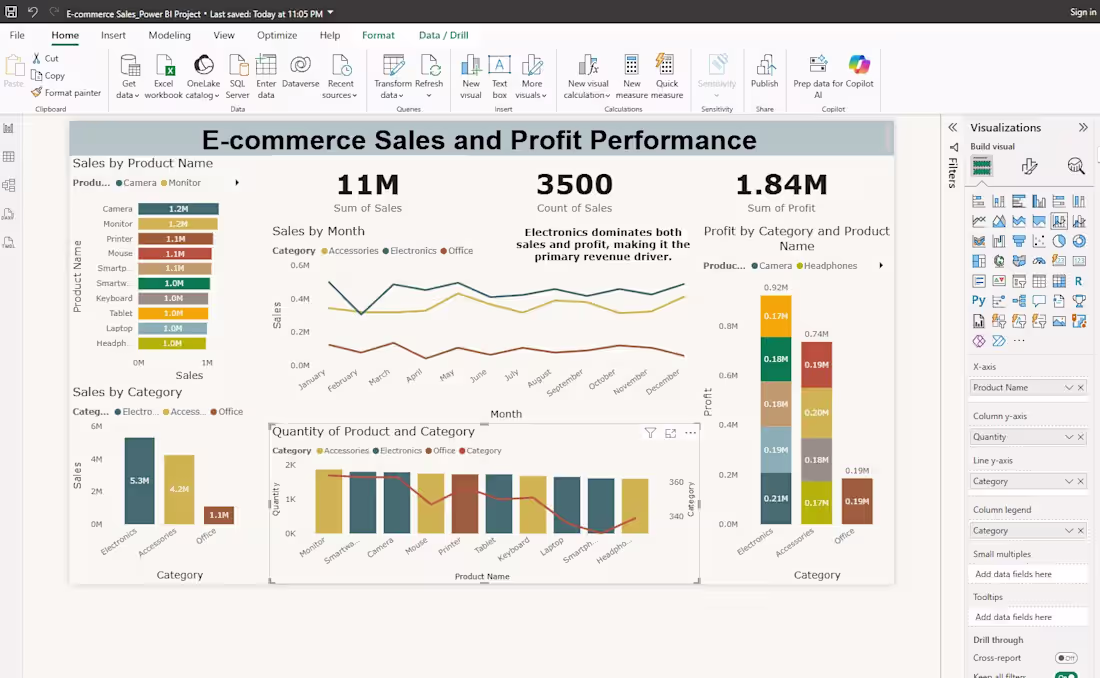
After working with Excel and Tableau, I challenged myself to build a more advanced dashboard focused on sales performance, profitability, and product trends. 😉
🔍 Key Insights:
• Total Sales reached 11M with 1.84M profit
• Electronics is the top-performing category across sales and profit
• Monthly sales show steady trends with fluctuations throughout the year
• Top products like Camera and Monitor drive strong performance
💡 What I focused on in this project:
✔ Building KPI-driven dashboards
✔ Applying data modeling and visualization in Power BI
✔ Improving data storytelling and layout design
Dataset: Kaggle - E-commerce Sales Performance
This project is part of my journey to become a Data Analyst, continuously learning through hands-on practice and self-study.
hashtag#PowerBI (https://www.linkedin.com/search/results/all/?keywords=%23powerbi&origin=HASH_TAG_FROM_FEED) hashtag#DataAnalytics (https://www.linkedin.com/search/results/all/?keywords=%23dataanalytics&origin=HASH_TAG_FROM_FEED) hashtag#DataVisualization (https://www.linkedin.com/search/results/all/?keywords=%23datavisualization&origin=HASH_TAG_FROM_FEED) hashtag#PortfolioProject (https://www.linkedin.com/search/results/all/?keywords=%23portfolioproject&origin=HASH_TAG_FROM_FEED) hashtag#OpenToWork (https://www.linkedin.com/search/results/all/?keywords=%23opentowork&origin=HASH_TAG_FROM_FEED)
0
29