The network for creativity
Join 1.25M professional creatives like you
Connect with clients, get discovered, and run your business 100% commission-free
Creatives on Contra have earned over $150M and we are just getting started
Back to feedPost

📊 Turn Business Data into Smarter Decisions
A great dashboard doesn't just display numbers — it helps businesses understand performance and make better decisions.
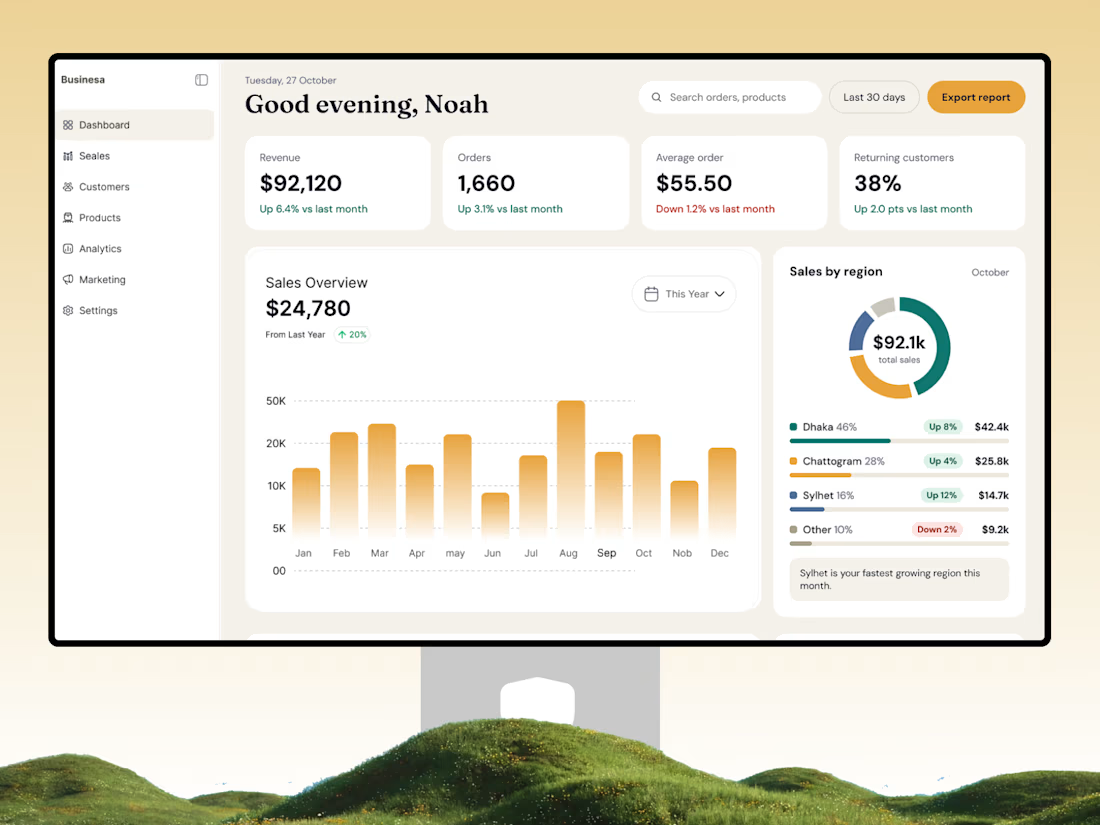
Introducing a modern Store Analytics Dashboard UI/UX Design by OrdainIT, designed for eCommerce businesses that need a clear view of their store performance.
✨ Design highlights:
Clean and intuitive dashboard interface
Revenue, orders, and customer analytics
Interactive sales overview and visual charts
Regional sales performance tracking
Key business metrics at a glance
Organized navigation and user-friendly layout
The goal is to simplify complex business data through a clean, structured, and easy-to-understand interface.
At OrdainIT, we design modern SaaS dashboards and digital products that combine usability with visual clarity.
💬 What's the most important metric you want to see first when opening an analytics dashboard?
#DashboardDesign #UIUXDesign #SaaSDesign #AnalyticsDashboard #ProductDesign #WebDesign #OrdainIT


The network for creativity
Join 1.25M professional creatives like you
Connect with clients, get discovered, and run your business 100% commission-free
Creatives on Contra have earned over $150M and we are just getting started
Related posts

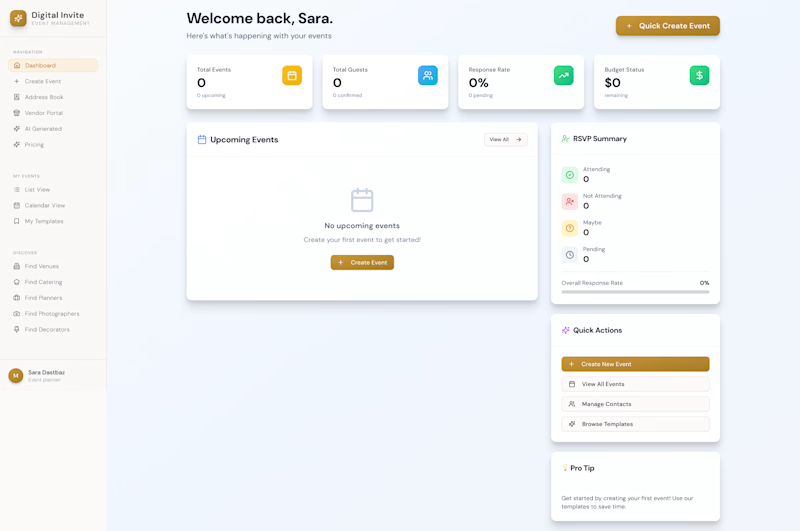
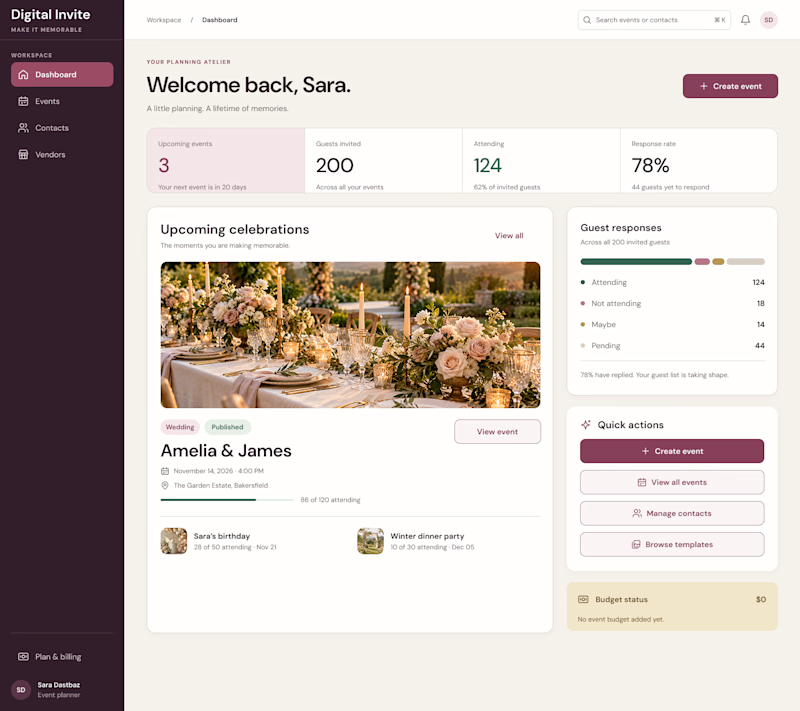
AI can generate a dashboard. But can it give a product its own identity?
The first design was created by my client using AI a familiar dashboard style you've probably seen across countless AI-generated products.
I redesigned it to feel less generic and more intentional, with a distinctive visual identity, clearer hierarchy, and an experience built around meaningful celebrations.
The goal wasn't just to make it look better. It was to make it feel like its own product.
What do you think is missing from most AI-generated interfaces?
#ProductDesign #UIDesign #AI
5 voted
23%
17 voted
77%
22 votes
Closed

I think personality is what makes a product stand out. A clean design is good, but it should also feel unique and memorable. 👏


We’re testing two filtering layouts for a template library.
Top Filters
The filters are placed above the content. This option feels lighter, leaves more space for the cards, and works well when there are only a few main categories.
Sidebar Filters
The categories remain visible in the sidebar. This makes the available options easier to scan and works better for more complex filtering, but takes up some of the content space.
Which layout would help you find the right template faster?

24 voted
39%
37 voted
61%
61 votes
Closed

Such a clean presentation. You can tell a lot of thought went into this.

Proper Form — Social Media Branding System
A flexible social media system created for Proper Form as part of the wider brand identity.
The template system was designed to adapt across different post formats, banners and platforms while maintaining a consistent visual language.
Rather than repeating one rigid layout, the system gives the brand room to vary composition, imagery and content while remaining clearly recognizable.
Created by Lepisov Branding in collaboration with Creative Mints.
Logo design: Ilya Gorchanyuk
Creative direction: Dmitry Lepisov
Brand identity + social system: Lepisov Branding × Creative Mints


This is how a social system should work: strong enough rules that the brand reads at thumbnail size, loose enough that the feed never looks copy-pasted. Do you hand clients a Figma kit for this, or build it in something their team edits themselves?