The network for creativity
Join 1.25M professional creatives like you
Connect with clients, get discovered, and run your business 100% commission-free
Creatives on Contra have earned over $150M and we are just getting started
Back to feedPost
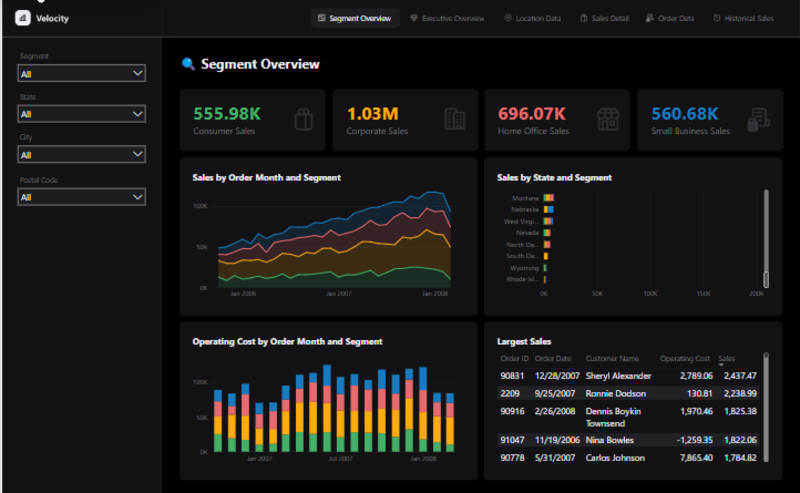
The Sales Segment Performance Dashboard provides a comprehensive view of sales distribution, operating costs, and customer segment performance across different regions. Designed using Power BI, this dashboard helps organizations analyze sales trends, identify high-performing markets, and monitor operational costs for better strategic planning.
Key KPIs Tracked
✔ Consumer Sales – Total revenue generated from individual customers
✔ Corporate Sales – Sales performance from corporate clients
✔ Home Office Sales – Revenue generated from home office segment
✔ Small Business Sales – Sales contribution from small businesses
Data VisualizationData AnalysisUI DesignMicrosoft ExcelMicrosoft Power BIFigmauidashboardpowerbidashboard
Breaking down performance by consumer, corporate, home office and small business segments in one view gives leadership exactly the clarity they need for strategic planning. Clean layout!
Thanks for noticing. The whole idea of this project was to help the leaders track their business, Your words are always inspiring to hear.
That's exactly the right goal — when leaders can see the full picture in one view, decisions become faster and more confident. Keep building great work!
Will do, TANK YOU!
Nicely done!
The network for creativity
Join 1.25M professional creatives like you
Connect with clients, get discovered, and run your business 100% commission-free
Creatives on Contra have earned over $150M and we are just getting started
Related posts


Love this!

Nice design
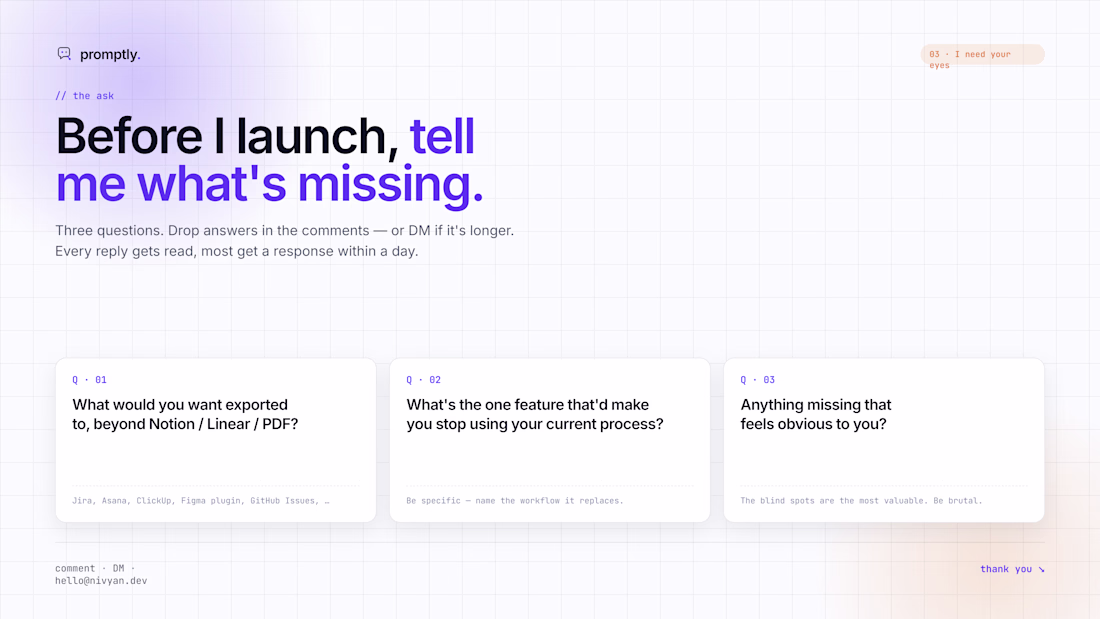
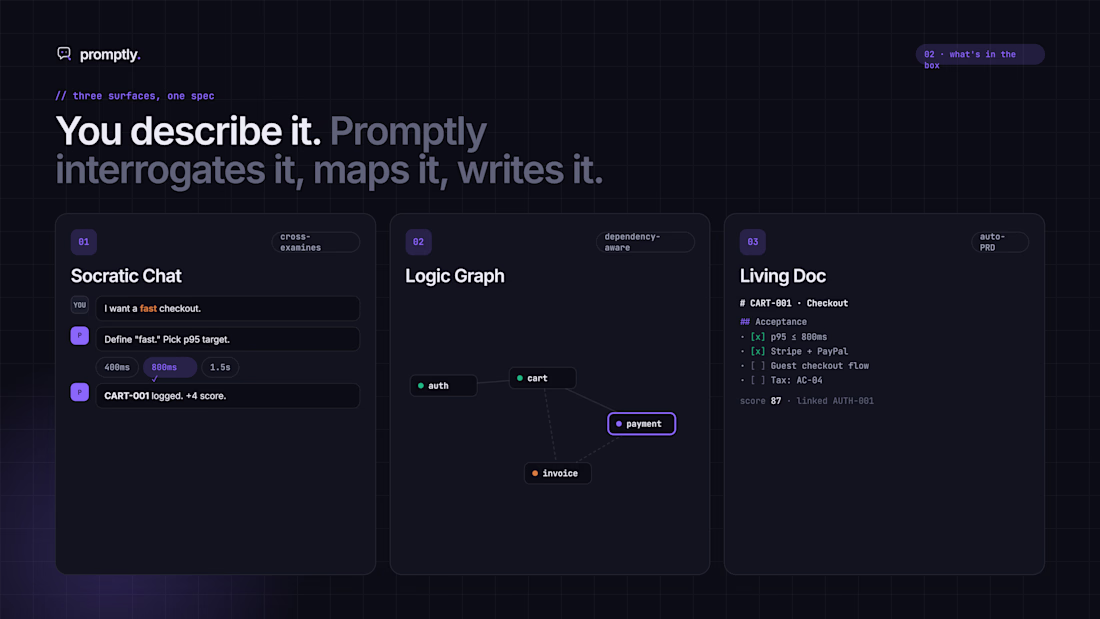
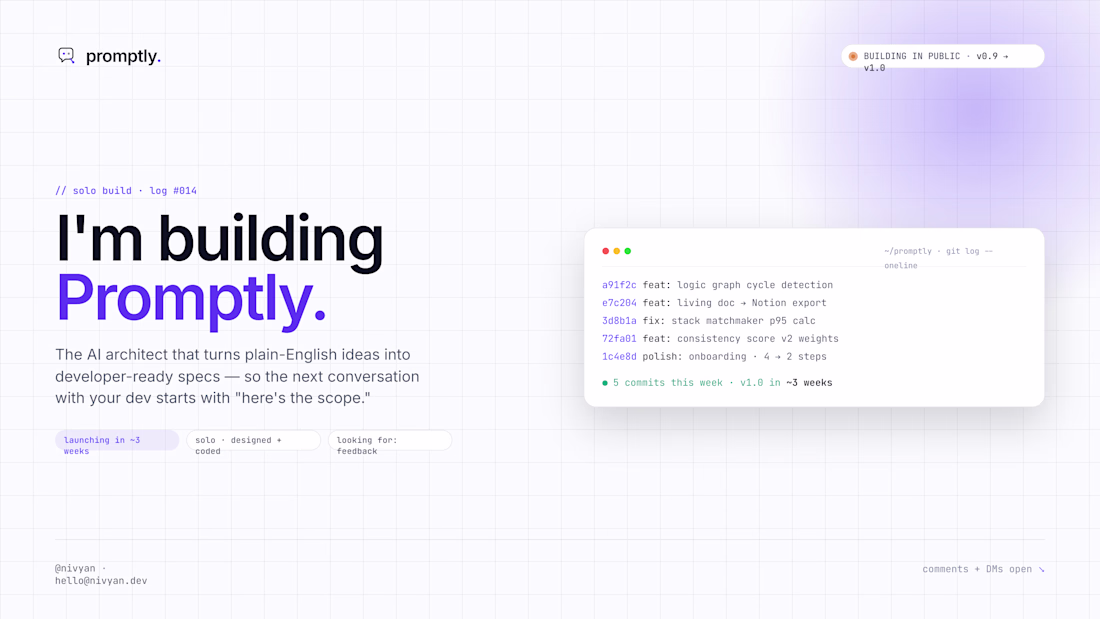
Hey Contra 👋 I've been heads-down building Promptly, and I'd love your eyes on it before our launch.
From my time delivering over 20 software projects as a tech lead, I realized the biggest bottleneck in building an app isn't the code itself. It is communication. Founders speak in ideas, and developers speak in strict logic.
Here is how Promptly works. You just describe your app idea in plain English. The AI actually pushes back, asks the hard questions, catches the vague bits, and automatically writes a developer-ready blueprint as you chat.
The goal is simple. When you hand this document to a developer, the next thing you get back is an accurate, fixed-price quote. No more wasting days trying to draft technical specifications and sitting through endless rounds of discovery calls just to get on the same page.
Instead of staring at a blank document, you get three tools that update in real-time:
The Pushback Chat: It refuses to just nod along. If you say "make it fast and secure," it helps you define exactly what that means. It hunts down edge cases before you ever pay someone to fix them.
The Visual Map: A live, interactive diagram showing exactly how your features connect. It catches logic flaws and missing steps before any code is written.
The Living Blueprint: An auto-generated, professional project spec that exports straight to Notion, Linear, or PDF.
Plus, it gives your idea a "Developer-Readiness Score" out of 100 so you know if it is actually ready to build. It even recommends the best tech stack based on your specific budget and complexity.
The core engine and all of these interactive features are fully functional right now, but I am still smoothing out the final rough edges. I am aiming for a public launch in about three weeks.
Where I need your help. I have three quick questions:
Where would you want to export your project blueprint, beyond Notion, Linear, or PDF?
What is the biggest headache you face right now when trying to explain your ideas to developers?
What feels missing? The blind spots are the most valuable to me right now.
Any feedback on new features, improvements, or things I should kill entirely would be hugely appreciated. Drop a comment below.
Thank you for taking a look 🙏
building solo, in public
Product ManagementFull Stack DevelopmentSoftware DevelopmentWeb DevelopmentAI DevelopmentClaudeNext.jsFigma
This is a very interesting concept! Where did you design the UI/UX? I feel like a better choice of font is still out there. Overall good work and clean UI. 🔥
Trending
Claude
Claude has entered the design space. How are you using Claude Design?
Contra University
Learn from expert creatives how to earn more using next-gen AI tools.
creativeaiflow
Creative AI workflows are evolving. What tools do you use, and what are their strengths and weaknesses?
portfolioreview
The best portfolios tell a story, not just show a grid. Share yours for feedback.
freelancerlife
Freelancer life is wins, pivots, and everything in between. What’s yours right now?