The network for creativity
Join 1.25M professional creatives like you
Connect with clients, get discovered, and run your business 100% commission-free
Creatives on Contra have earned over $150M and we are just getting started
Back to feedPost

Retail Fraud Analysis
Business Gap & Problem
Retail businesses suffer significant financial losses through fraudulent transactions and ineffective fraud monitoring. Without clear visibility, organizations struggle to identify where fraud occurs, understand the behavioral indicators tied to suspicious transactions, and translate data into practical risk management recommendations.
Solution
Built an end-to-end retail fraud analytics solution to analyze high-volume transaction logs, track suspicious activity flags, and present actionable risk intelligence through a multi-page Power BI dashboard.
Page-by-Page Dashboard Breakdown
1. Overview Page
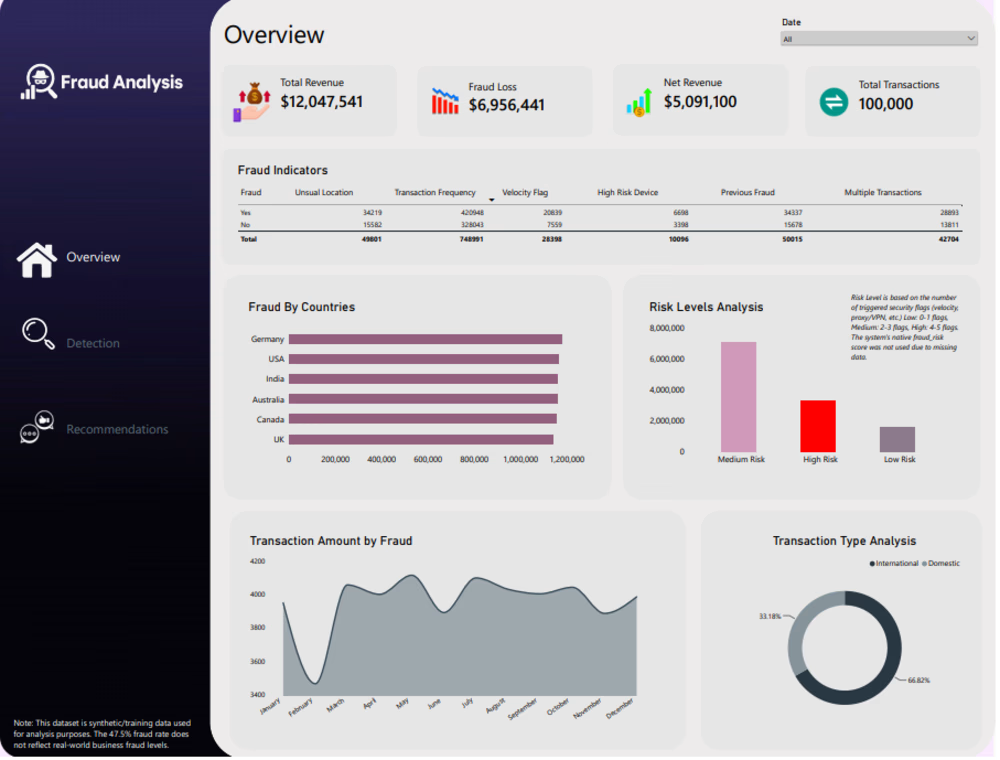
Purpose: Serves as the high-level financial command center, tracking overall enterprise revenue against fraud exposure and categorizing risk tiers.
Key Metrics & Visuals: Displays top-level KPI cards for Total Revenue ($12.04M), Fraud Loss ($6.95M), Net Revenue ($5.09M), and Total Transactions (100k). Features a fraud indicators matrix, regional fraud breakdown across top countries, transaction amount trends by fraud over time, domestic vs. international transaction distribution, and a risk level analysis chart categorizing exposure into Low, Medium, and High risk.
2. Detection Page
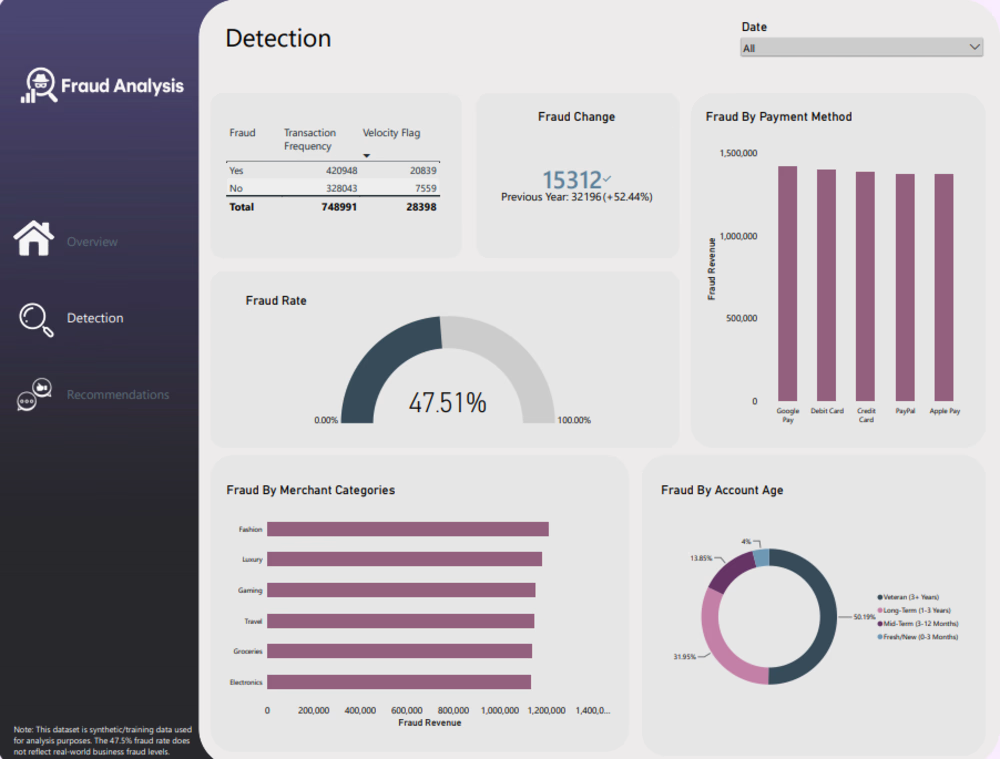
Purpose: Focuses deeply on transaction-level detection mechanics, velocity flags, and vulnerable merchant or payment categories.
Key Metrics & Visuals: Highlights fraud change metrics year-over-year (+52.44%) and a global fraud rate gauge (47.51%). Includes a transaction frequency matrix, fraud revenue by payment method (spanning Google Pay, Debit Card, Credit Card, PayPal, and Apple Pay), fraud revenue across merchant categories (Fashion, Luxury, Gaming, Travel, Groceries, Electronics), and a breakdown of fraud by account age.
3. Recommendations Page
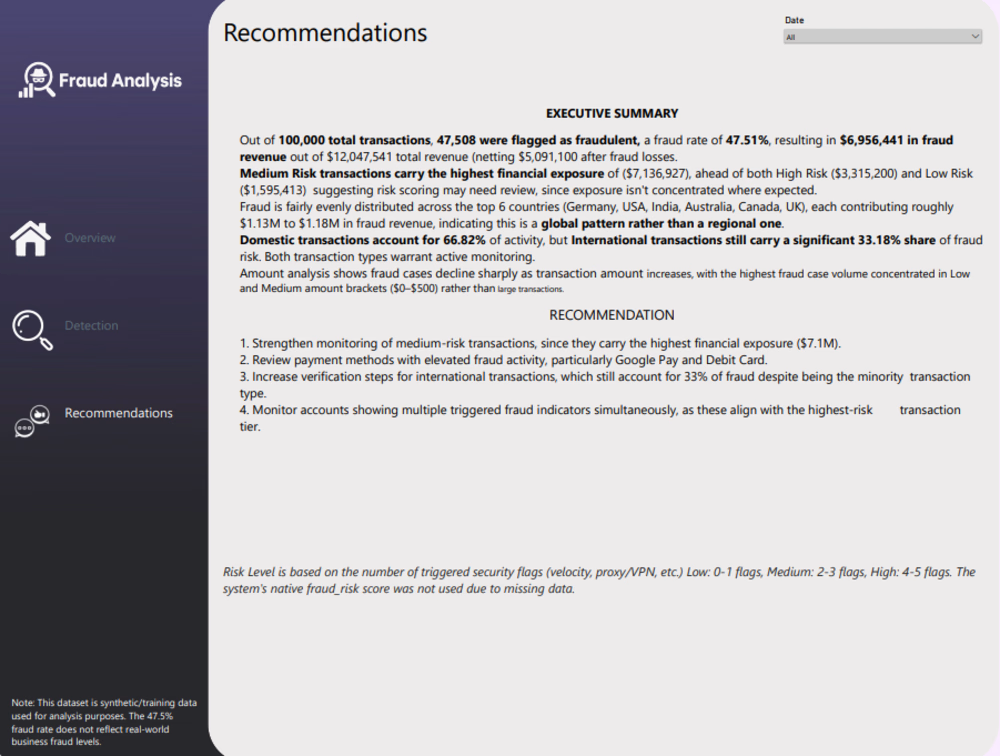
Purpose: Translates complex analytical findings into an executive-ready summary and actionable risk mitigation strategies.
Key Metrics & Visuals: Features a structured Executive Summary detailing financial exposure across risk tiers (noting that Medium Risk carries the highest exposure at $7.1M) and a targeted Recommendation section advising management to strengthen medium-risk monitoring, review specific payment methods, enhance international verification steps, and track multi-indicator accounts.


The network for creativity
Join 1.25M professional creatives like you
Connect with clients, get discovered, and run your business 100% commission-free
Creatives on Contra have earned over $150M and we are just getting started

Challenges
View all


Related posts

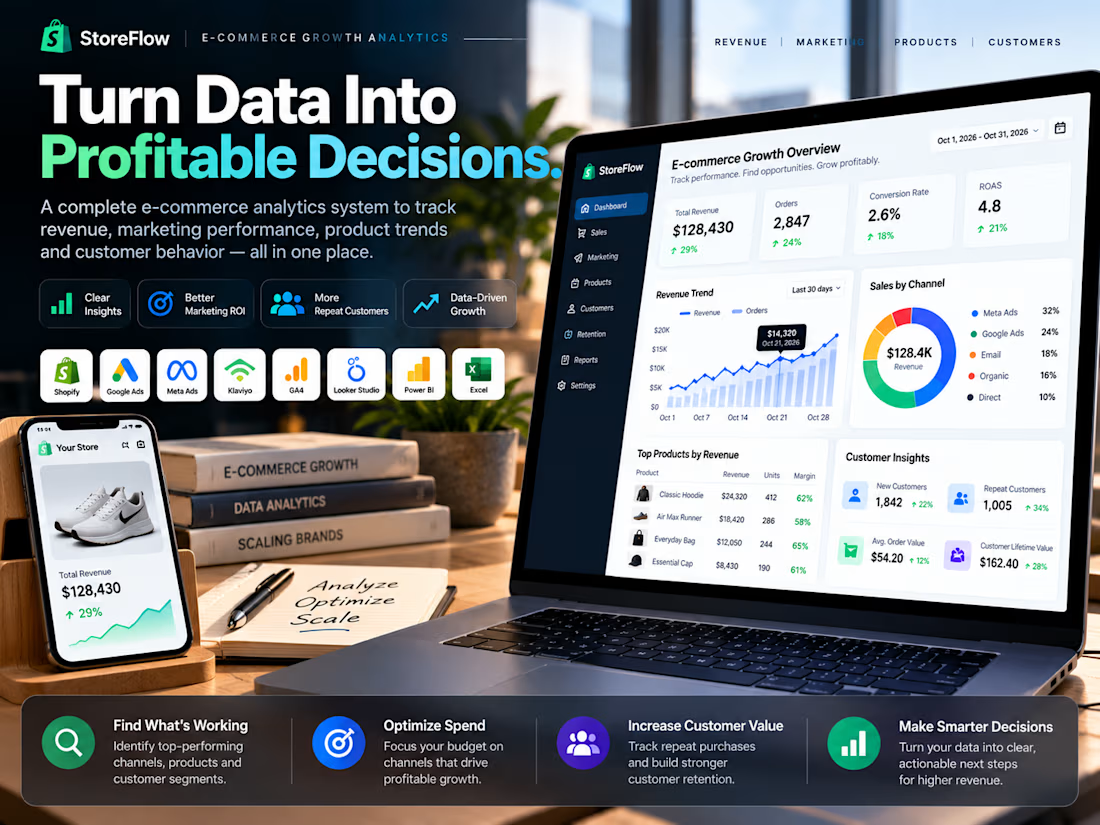
See exactly what’s driving revenue, where growth is leaking, and which products, channels, and customers deserve more investment.
I developed an e-commerce growth intelligence system around one question:
Where should the business invest next?
Most stores already have plenty of data. The harder problem is understanding what that data means for revenue, marketing spend, products, and customer growth.
So instead of building another dashboard full of charts, I’m structuring the system around decisions.
It brings together signals such as revenue, ROAS, CAC, conversion, product performance, repeat purchases, and retention to identify things like:
which channels deserve more budget, where acquisition is becoming inefficient, which products attract traffic but fail to convert, and where repeat customers are creating stronger value.
The goal isn’t just to answer:
“What happened?”
It’s to answer:
“What should we do next?”
Because the most useful analytics system isn’t the one with the most charts.
It’s the one that makes the next business decision clearer.
Tags: E-Commerce · Marketing Analytics · Data Analytics · Power BI · E-commerce Management
Marketing AnalyticsData AnalysisecommerceeCommerce ManagementMicrosoft ExcelMicrosoft Power BIShopify



Exactly. Analytics becomes much more valuable when it helps businesses make smarter decisions, not just track numbers.

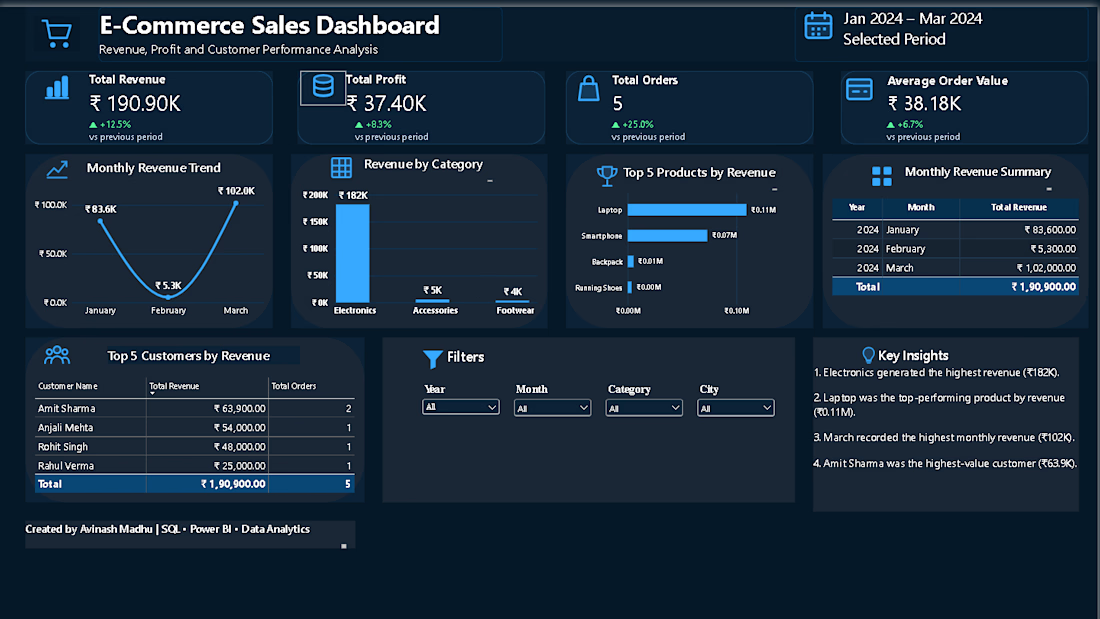
E-Commerce Sales Dashboard | Power BI & SQL
Built an interactive e-commerce sales dashboard using SQL and Power BI to analyze revenue, profit, orders, product performance, customer performance, and monthly sales trends.
Key features:
Revenue and profit KPI tracking
Monthly revenue trend analysis
Category and product performance
Top customer analysis
Interactive Year, Month, Category, and City filters
Revenue summary and business insights Tools: SQL, Power BI, Data Analysis, Data Visualization

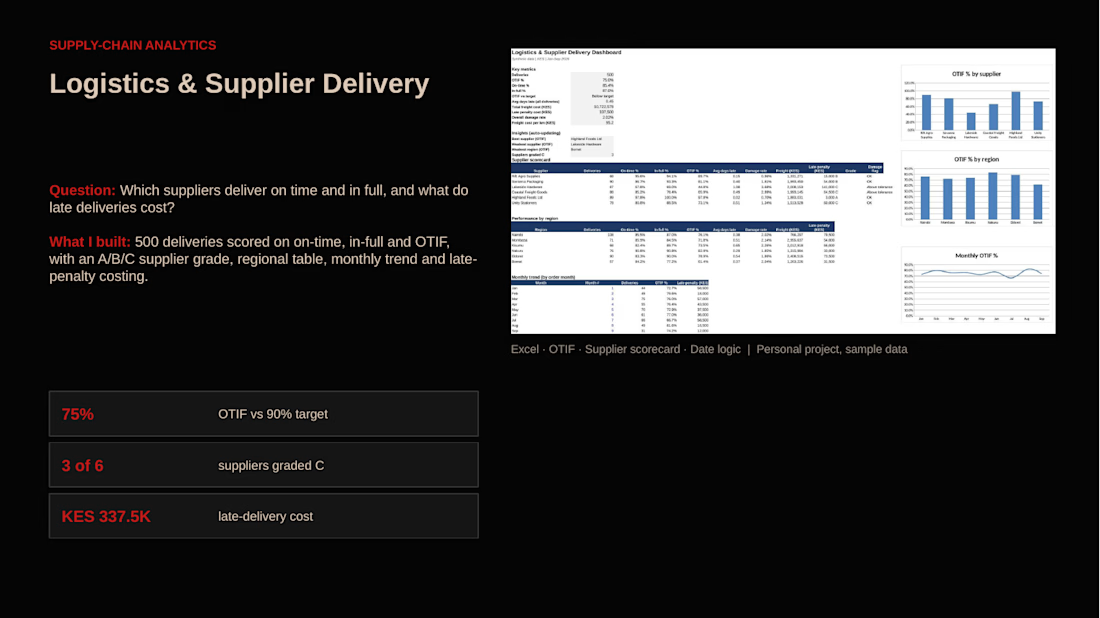
Logistics & Supplier Delivery