The network for creativity
Join 1.25M professional creatives like you
Connect with clients, get discovered, and run your business 100% commission-free
Creatives on Contra have earned over $150M and we are just getting started
Back to feedPost

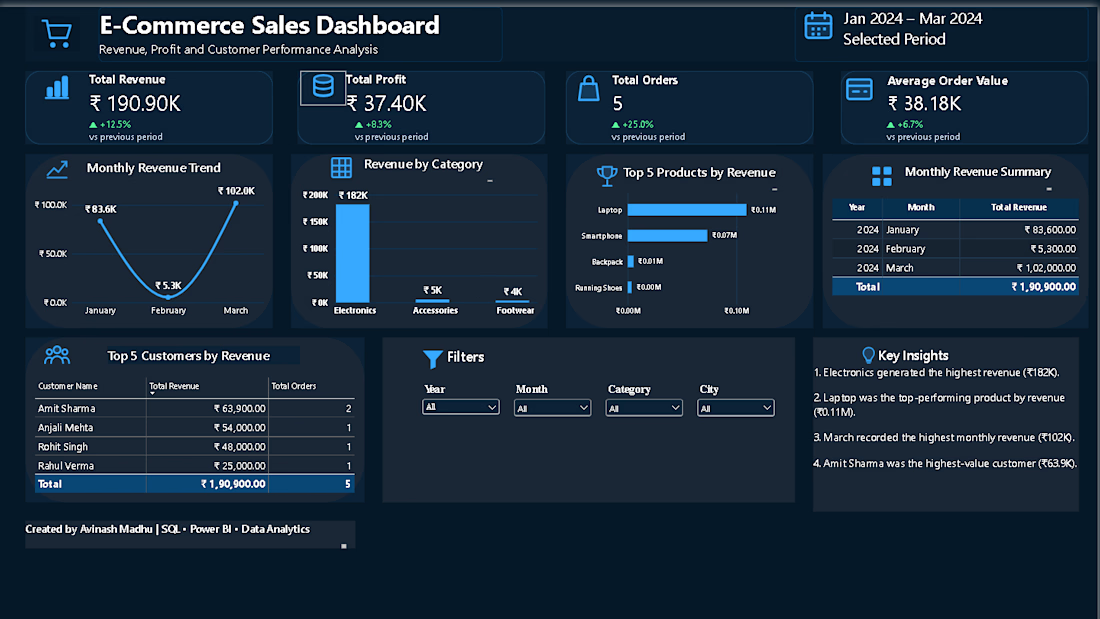
E-Commerce Sales Dashboard | Power BI & SQL
Built an interactive e-commerce sales dashboard using SQL and Power BI to analyze revenue, profit, orders, product performance, customer performance, and monthly sales trends.
Key features:
Revenue and profit KPI tracking
Monthly revenue trend analysis
Category and product performance
Top customer analysis
Interactive Year, Month, Category, and City filters
Revenue summary and business insights Tools: SQL, Power BI, Data Analysis, Data Visualization


The network for creativity
Join 1.25M professional creatives like you
Connect with clients, get discovered, and run your business 100% commission-free
Creatives on Contra have earned over $150M and we are just getting started





Related posts

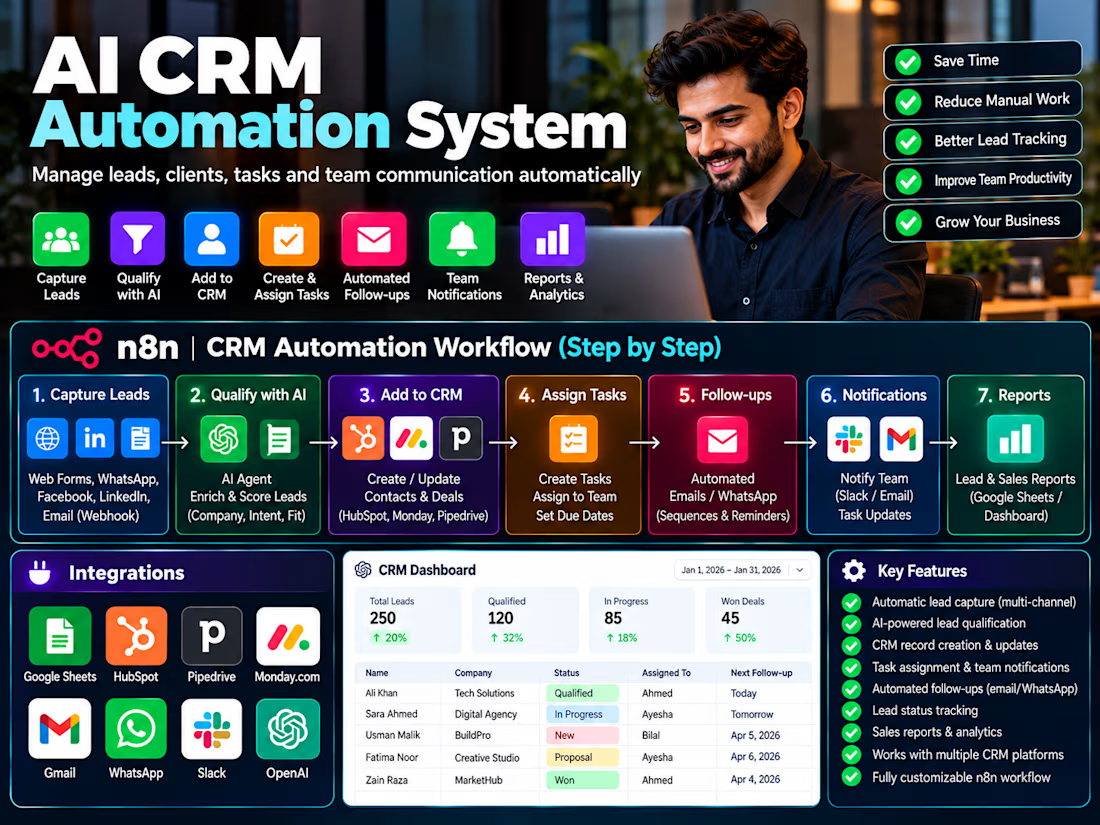
Built an n8n CRM automation system that captures leads, creates and updates CRM records, assigns tasks, sends team notifications, automates follow-ups and generates reports.


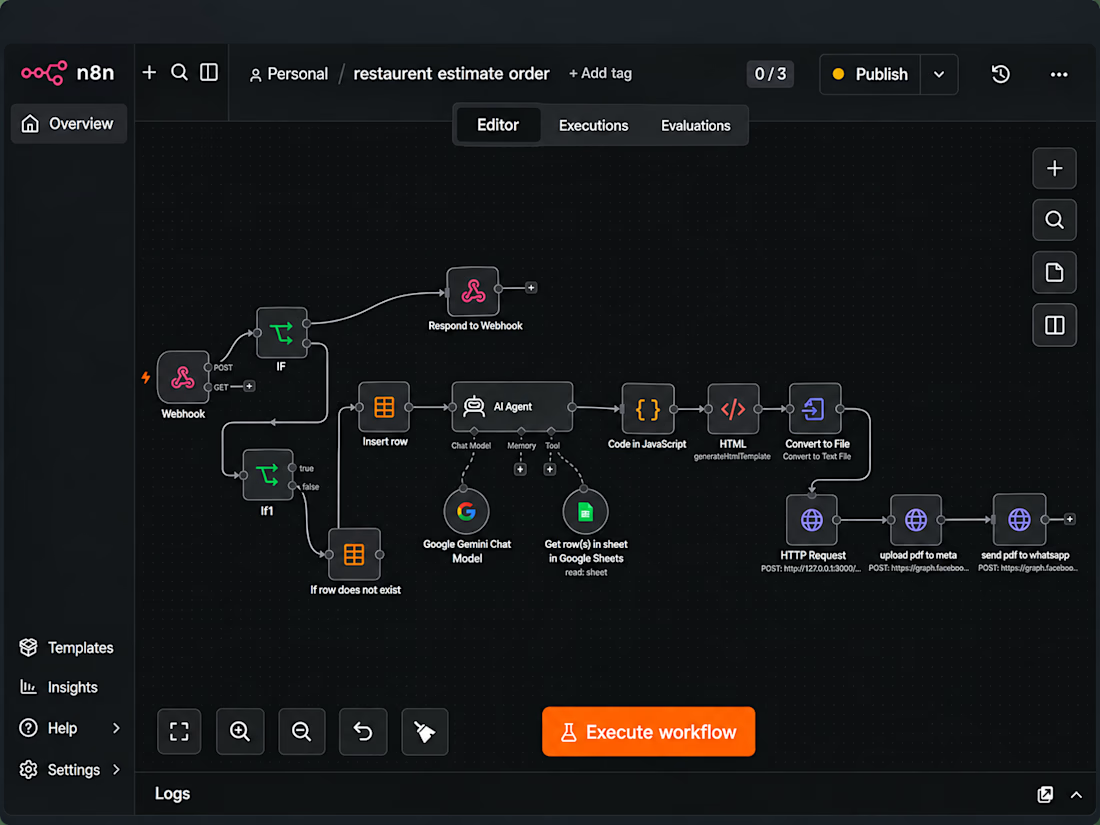
Restaurant Automation System. Automates WhatsApp orders, menu & pricing lookup, estimate generation, PDF invoices, and order processing using n8n, Google Sheets, Gemini AI and WhatsApp Cloud API.



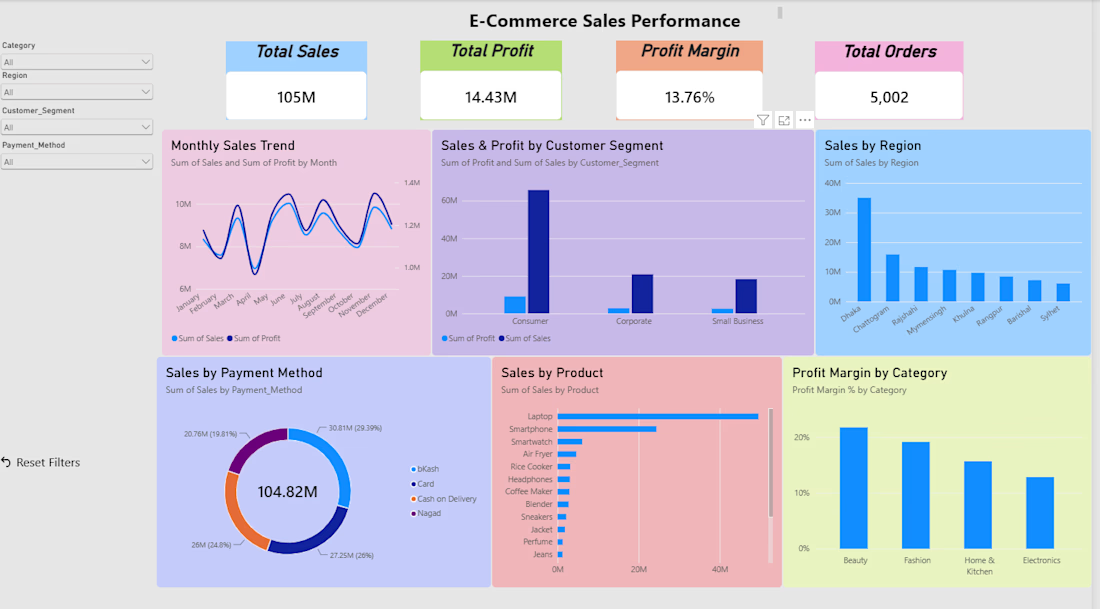
E-Commerce Sales & Profit Analysis | Power BI Dashboard
Project Description
An end-to-end e-commerce analytics project focused on understanding sales performance, profitability, customer behavior, and regional trends.
I analyzed 5,000+ orders to identify key business trends and performance drivers.
Key Areas Analyzed:
📈 Total Sales & Profit
📅 Monthly Sales Trends
👥 Customer Segment Performance
🌍 Regional Sales Analysis
📦 Product Performance
💰 Profit Margin by Category
💳 Payment Method Analysis
What I did:
• Cleaned and prepared the dataset using Excel
• Performed SQL-based analysis using PostgreSQL
• Built an interactive Power BI dashboard
• Created KPIs and visualizations to track business performance
• Analyzed sales, profit, customers, products, and regional performance
• Generated business insights from the analyzed data
Tools:
Excel • PostgreSQL • SQL • Power BI
Workflow:
Raw Data → Excel → PostgreSQL → SQL Analysis → Power BI → Business Insights
Outcome:
The dashboard provides a clear view of e-commerce performance and helps identify sales trends, profitable categories, customer segments, and areas for business improvement.