The network for creativity
Join 1.25M professional creatives like you
Connect with clients, get discovered, and run your business 100% commission-free
Creatives on Contra have earned over $150M and we are just getting started
Back to feedPost
Built this Service Performance Dashboard in Power BI ⚡
Transformed raw data into actionable insights on:
• Revenue & profit trends
• Cost optimization opportunities
• Technician performance
• Regional performance analysis
Used interactive visuals, filters, and KPIs to make decision-making faster and clearer.
Key takeaway? A dashboard isn’t about visuals—it’s about driving decisions.
More projects dropping soon 🚀
powerbidashboarddataanalystbusinessintelligenceMicrosoft Power BIData AnalysisData ScienceData Visualization
The network for creativity
Join 1.25M professional creatives like you
Connect with clients, get discovered, and run your business 100% commission-free
Creatives on Contra have earned over $150M and we are just getting started
Related posts
Building a brand new AI Fintech dashboard components
WIP :)
Cool
AI ads don't have to suck! what do you think of these two?
The process here was:
Creative strategist = concept x brief
Visual Asset manager = produce necessary screen recordings
Video editors = create AI scenes needed x edit together with recordings
4 voted
80%
1 voted
20%
5 votes
Closed
Adding the cat was genius, makes it seem way more natural. What generators are you using? Some of the most realistic looking people I've seen. 😅
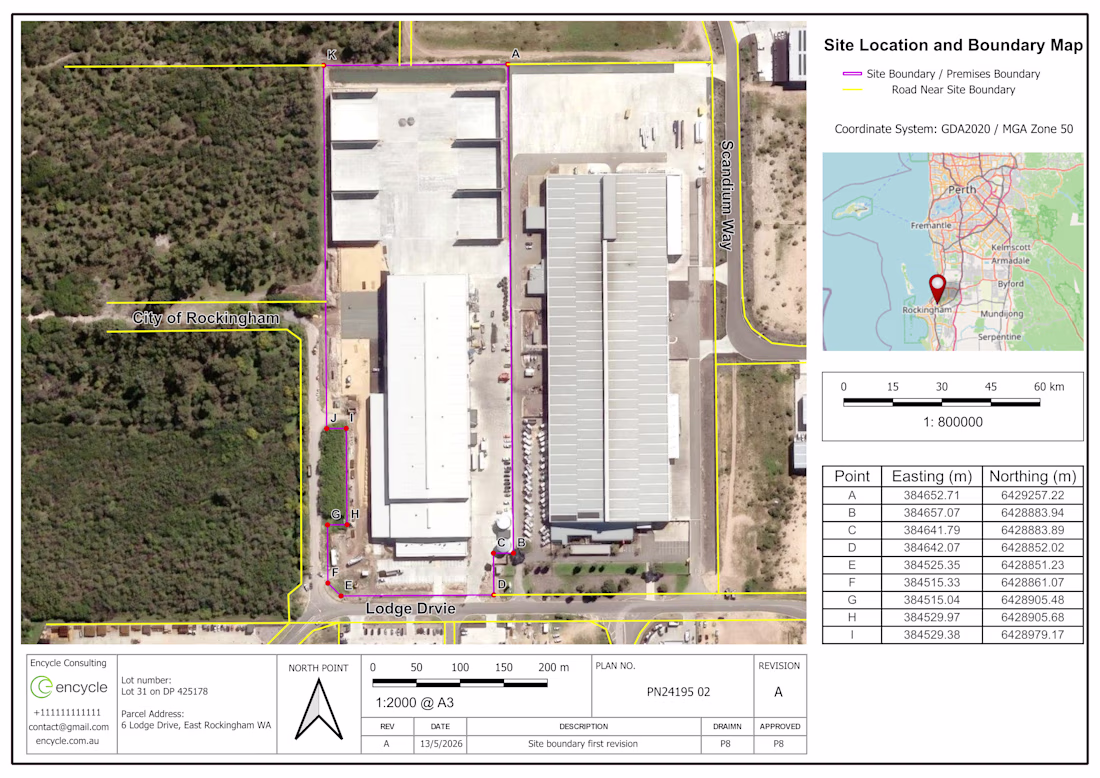
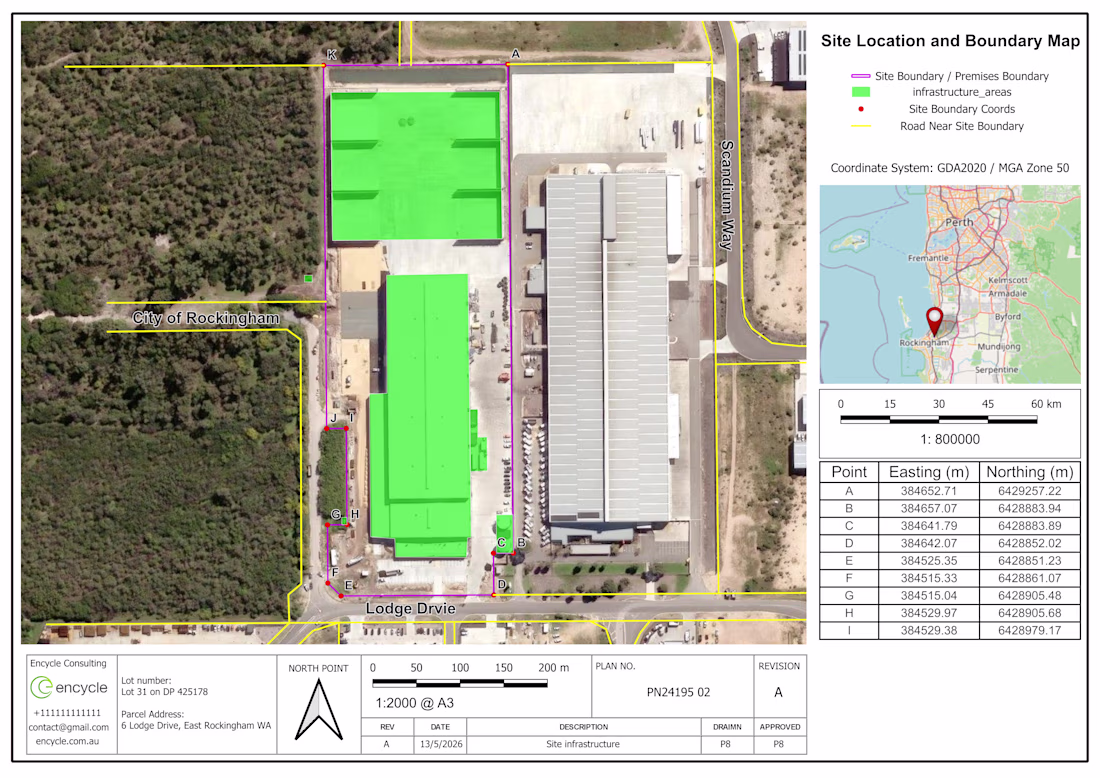
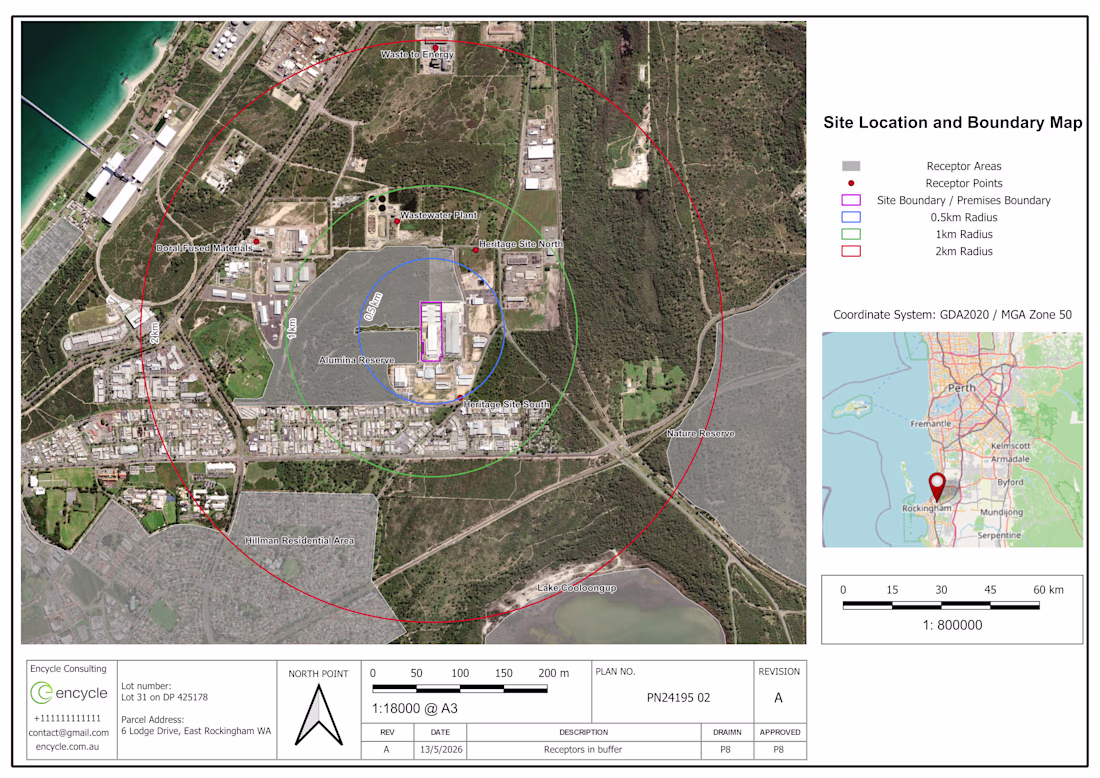
😊 GIS Mapping and Environmental Site Plan Development for Approval Documentation
I developed a professional GIS mapping package for an environmental approval project, including site boundary mapping, receptor buffer analysis, infrastructure marking, coordinate tables, A3 layout design, scale bars, legends, north arrows, and regional location insets. The final outputs were prepared as clear, approval-ready maps using high-resolution aerial imagery and GDA2020 / MGA Zone 50 coordinate reference standards.:
His work so cool!
Trending
Claude
Claude has entered the design space. How are you using Claude Design?
Contra University
Learn from expert creatives how to earn more using next-gen AI tools.
creativeaiflow
Creative AI workflows are evolving. What tools do you use, and what are their strengths and weaknesses?
portfolioreview
The best portfolios tell a story, not just show a grid. Share yours for feedback.
freelancerlife
Freelancer life is wins, pivots, and everything in between. What’s yours right now?