The network for creativity
Join 1.25M professional creatives like you
Connect with clients, get discovered, and run your business 100% commission-free
Creatives on Contra have earned over $150M and we are just getting started
Back to feedPost

SaaS Unit Economics & Churn Dashboard for Founders
Most SaaS founders track revenue but can’t say whether each customer is worth what it cost to win them. This dashboard answers that in seconds.
It models a subscription business over 12 months. Change the price, the monthly churn, the acquisition cost or the gross margin, and the dashboard recalculates customer lifetime, lifetime value, the LTV to CAC ratio and the months it takes to earn back the acquisition cost.
A stacked chart shows how the customer base changes: the customers you started with fade out through churn while new ones build up, and a table underneath shows the revenue, acquisition spend and net contribution for each month.
It’s a simplified demo with sample data. For a real company I build the full model around your own pricing, churn and acquisition numbers.
This is one of several financial dashboards I build for early-stage startups. If you’d like one for your numbers, send me a message.


The network for creativity
Join 1.25M professional creatives like you
Connect with clients, get discovered, and run your business 100% commission-free
Creatives on Contra have earned over $150M and we are just getting started



Related posts


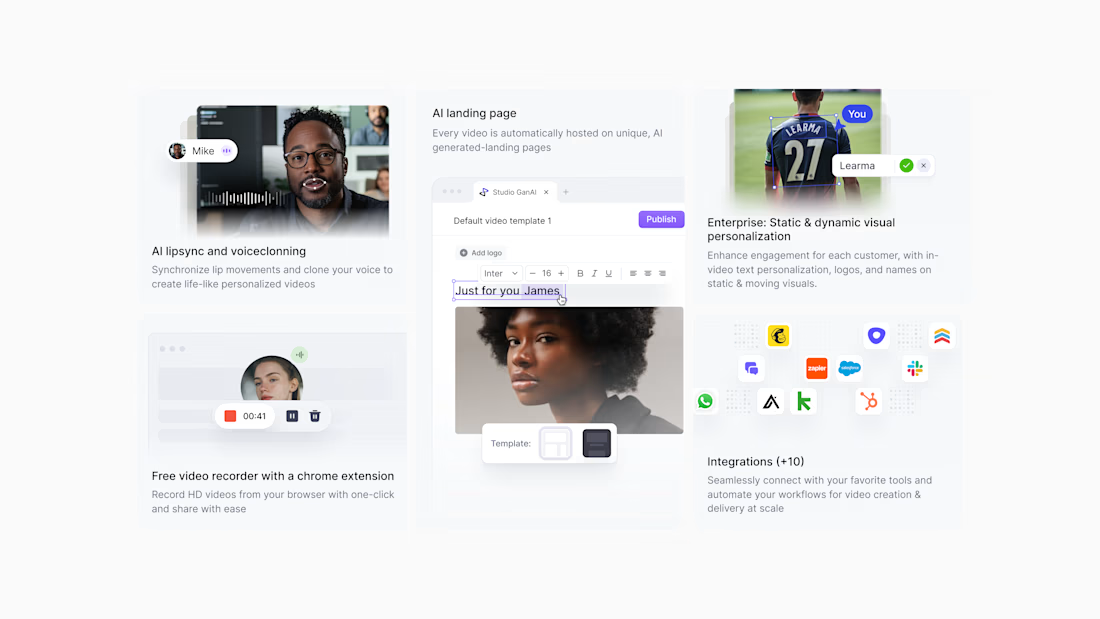
A bento grid that explains a generative-AI product at a glance, designed for GanAI.

BMW M4 Competition App Design | UI/UX Case Study We Designer Mobile Designer
I designed a premium automotive app experience inspired by the BMW M4 Competition, combining a bold visual identity with a sleek, modern interface. The design features cinematic car visuals, dynamic speed animations, performance specifications, and an immersive dark theme with electric-blue accents.
The interface highlights key performance details, including acceleration, horsepower, torque, and top speed, creating a high-end digital experience for automotive enthusiasts. Every screen is designed to communicate power, precision, and innovation through clean typography, striking visuals, and smooth transitions.
Key Features:
Premium automotive UI/UX design
Interactive speedometer and motion animations
Performance statistics and technical specifications
Dark-themed interface with electric-blue highlights
Cinematic visuals and engaging transitions
Modern layout with a performance-focused user experience
My Role: UI/UX Designer & Visual Designer Project Type: Automotive App Concept Focus: User Interface, Visual Design, Motion Design & Interactive Experience
Design Philosophy: Engineered beyond limits — transforming automotive performance into an immersive digital experience.


This is very dope.

From static footer to motion.
It's crazy how adding motion can take something from OK to premium in an instant.

Great work