The network for creativity
Join 1.25M professional creatives like you
Connect with clients, get discovered, and run your business 100% commission-free
Creatives on Contra have earned over $150M and we are just getting started
Back to feedPost

Automated Business Overview Dashboard (Google Sheets)
Project Description:
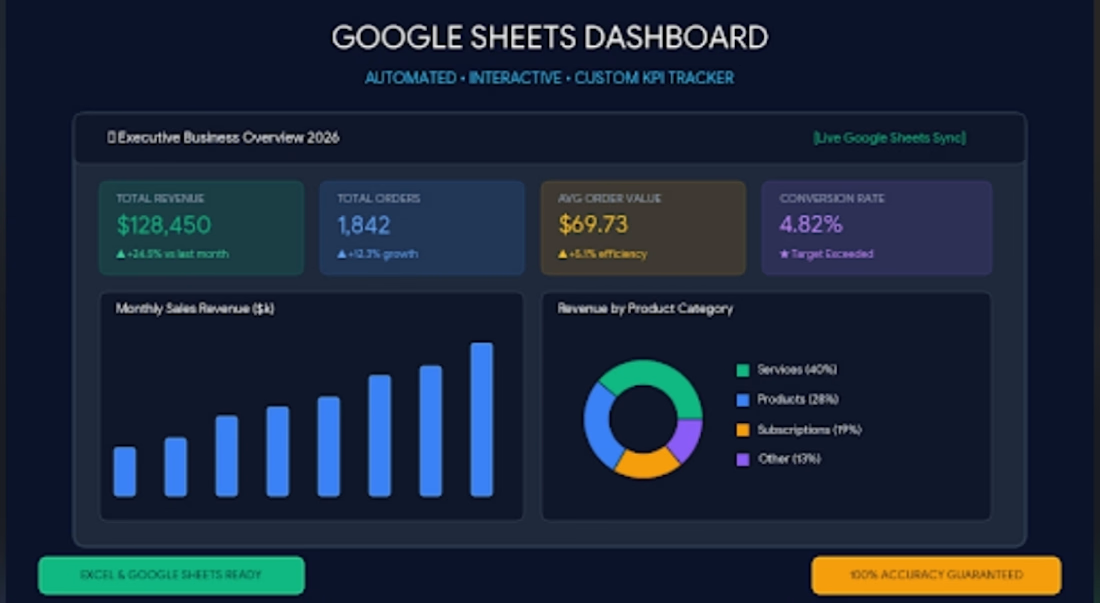
I developed a fully automated and interactive executive dashboard using Google Sheets. This tool is designed to provide business leaders with a real-time, comprehensive overview of their critical performance metrics (KPIs) in a single, visually appealing interface.
Key Features:
Custom KPI Tracking: Real-time monitoring of essential metrics such as Total Revenue, Total Orders, Average Order Value (AOV), and Conversion Rates, complete with period-over-period growth indicators.
Dynamic Data Visualization: Integration of clean, easy-to-read charts, including monthly sales revenue bar graphs and product category revenue pie charts.
Automated Data Sync: Built to seamlessly pull and process live data, eliminating the need for manual updates and ensuring 100% accuracy.
Impact: This dashboard empowers decision-makers to quickly analyze business health, identify sales trends, and make data-driven decisions without getting lost in raw spreadsheet data.


The network for creativity
Join 1.25M professional creatives like you
Connect with clients, get discovered, and run your business 100% commission-free
Creatives on Contra have earned over $150M and we are just getting started











Related posts

The only glow on the Kestra page is the reflective strip on the jacket. It comes from the image itself, so the Framer layers on top stay flat: grey, white and mono text, no glow effects on buttons or headings. That keeps the page easy to edit, because nothing in the UI depends on one lighting setup. If you swap the photo, the glow goes with it. Would you add a glow effect in Framer or keep it in the image?


wow, nothing but top notch

A flower that inflates arrives in the mail.
Next month, a phone made of shell.
STILL LIFE SERVICE. Case study dropping soon.
Which object earns your shelf? Reply below.
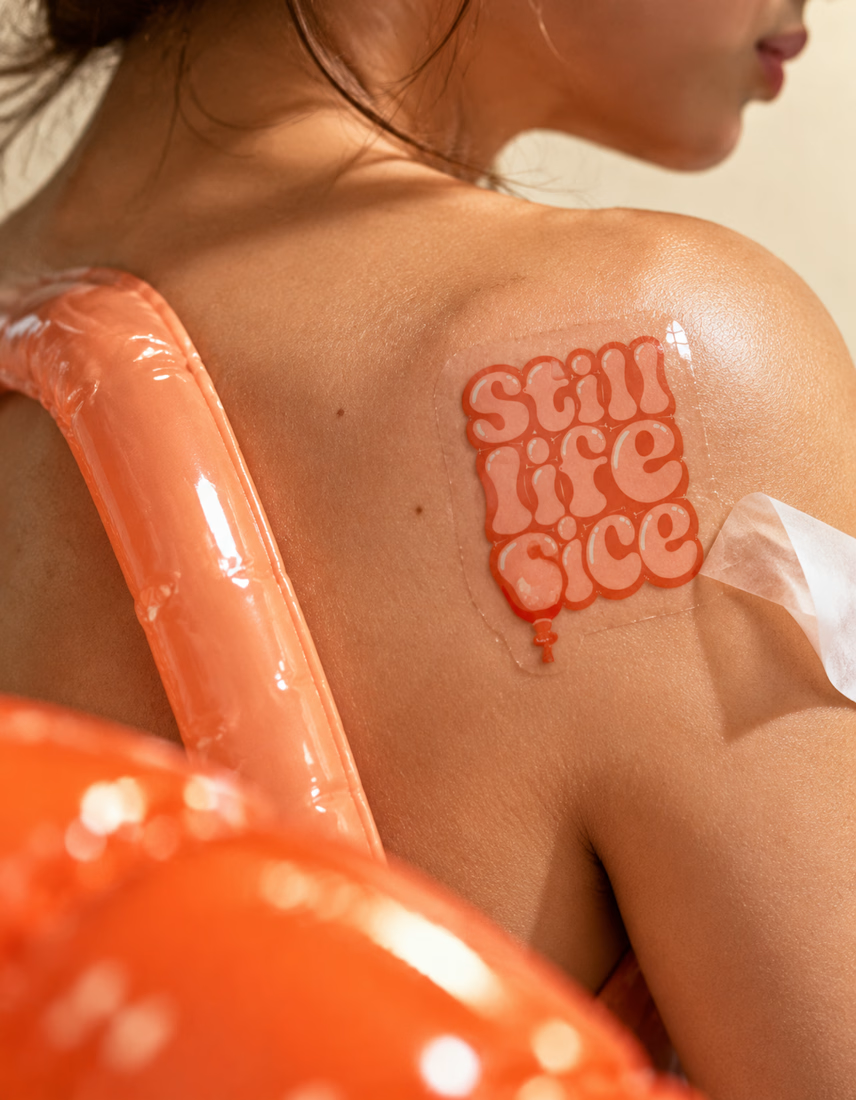

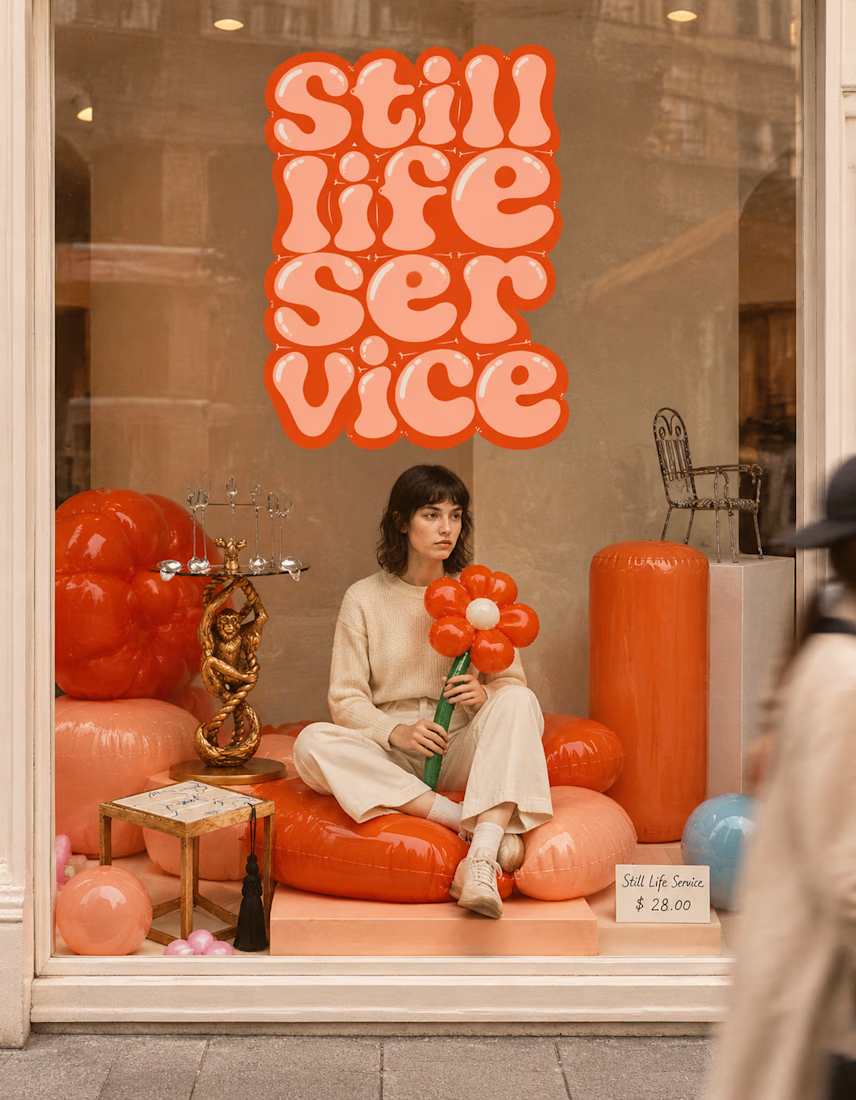

The inflatable flower. Only houseplant I'm guaranteed not to kill. Also, a new object every month is a sneaky good retention hook, people will stay subscribed just to see what's next.

Built this in Framer as a concept project. Goal was to make it feel run by ex-journalists. Choices: editorial serif (Libre Baskerville), a dark photo with one color accent, and copy that positions against blast-style PR.
Where I’m unsure: text legibility over the photo and whether the two CTAs compete. What would you change?

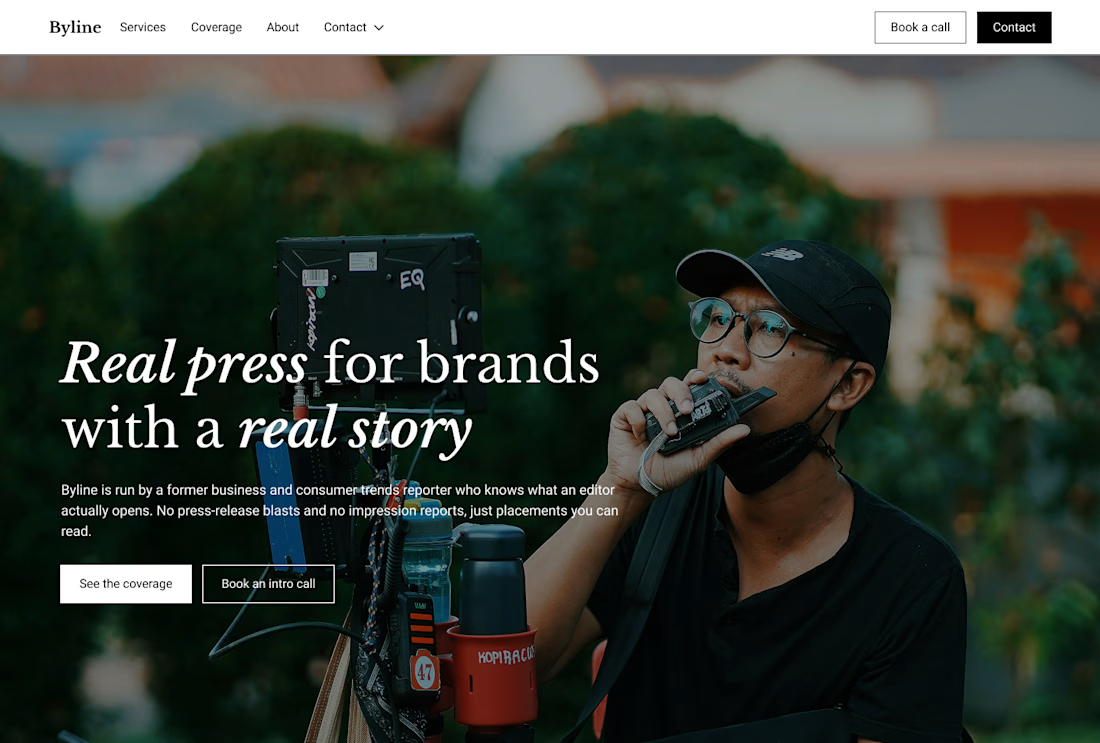

That's great design it feels professional I like how the background mixed with interface ❤️❤️
Great job Cheree🎉🎉