The network for creativity
Join 1.25M professional creatives like you
Connect with clients, get discovered, and run your business 100% commission-free
Creatives on Contra have earned over $150M and we are just getting started
Back to feedPost

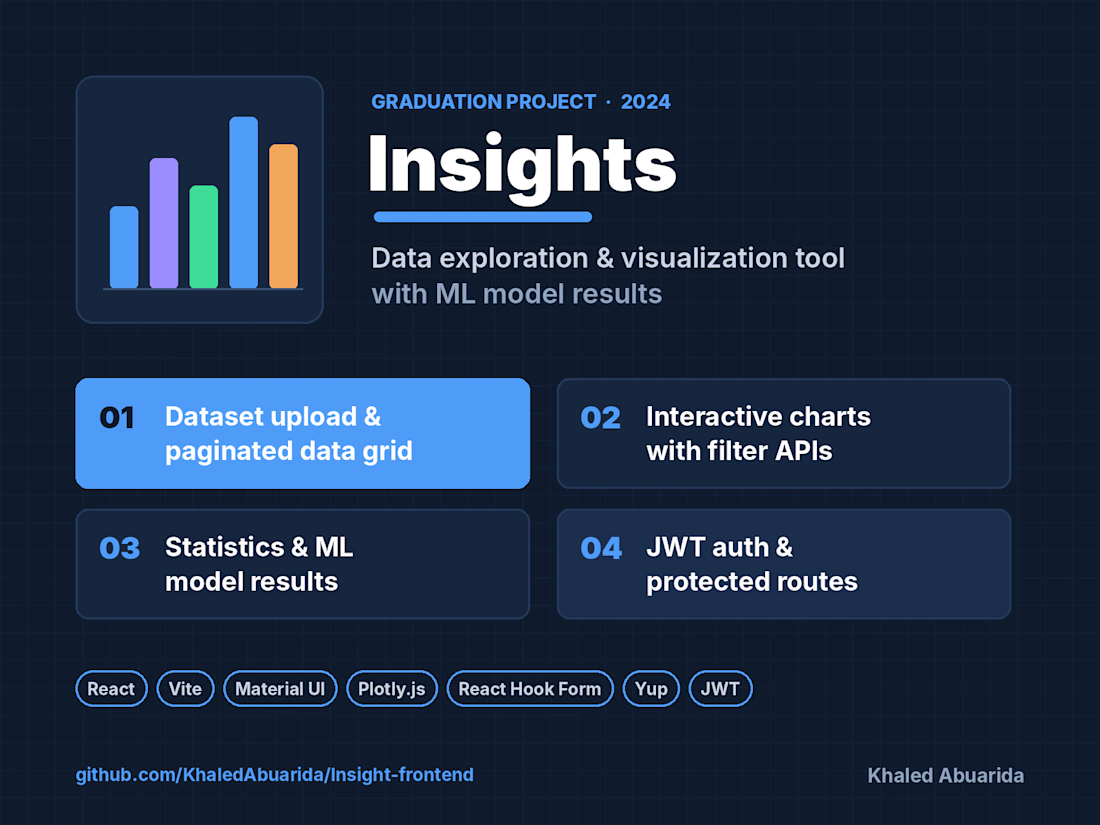
Insights is my graduation project from Ain Shams University (2024): a web tool that lets users upload datasets, explore them, and find insights through statistics, interactive charts, and machine learning model results.
I built the frontend, including:
• Dataset upload with drag and drop, plus a paginated data grid
• Interactive charts powered by filter APIs
• Statistics pages and ML model result views
• Sign-up, sign-in, and JWT authentication with protected routes
• Form validation with React Hook Form and Yup
Stack: React, Vite, Material UI, Plotly.js, React Hook Form, Yup


The network for creativity
Join 1.25M professional creatives like you
Connect with clients, get discovered, and run your business 100% commission-free
Creatives on Contra have earned over $150M and we are just getting started











Related posts

looking for a great designer

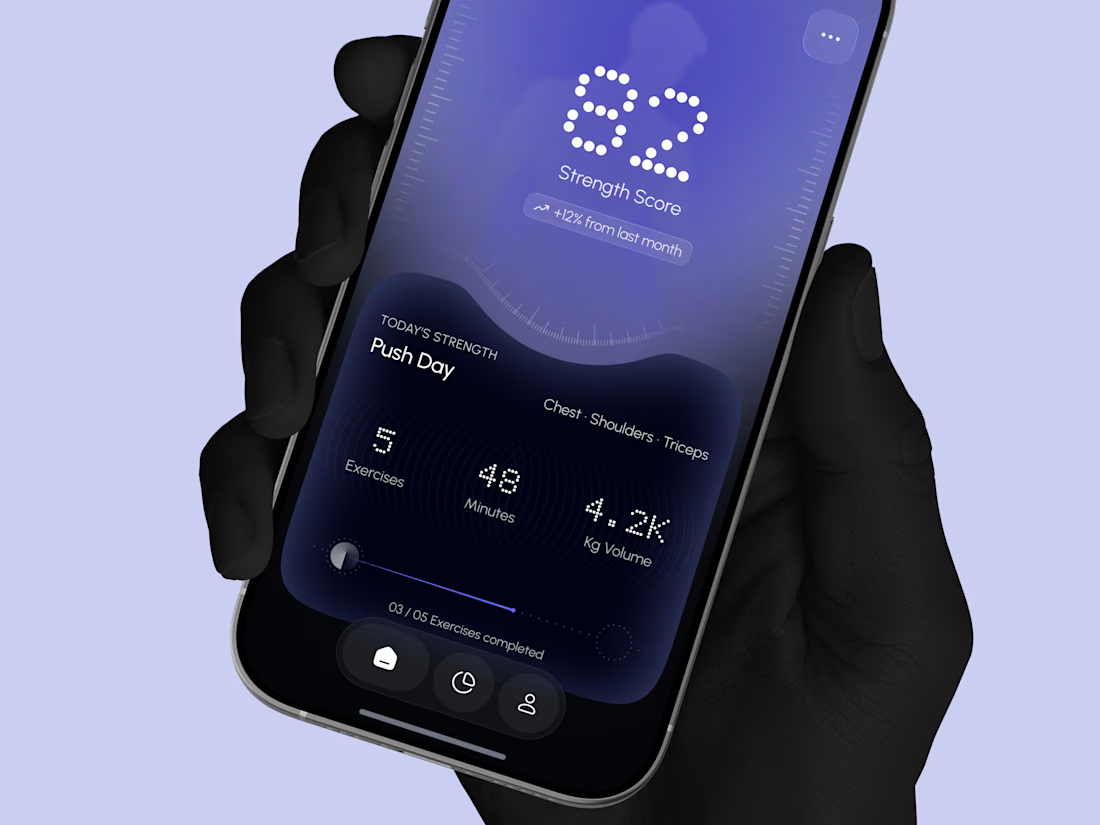
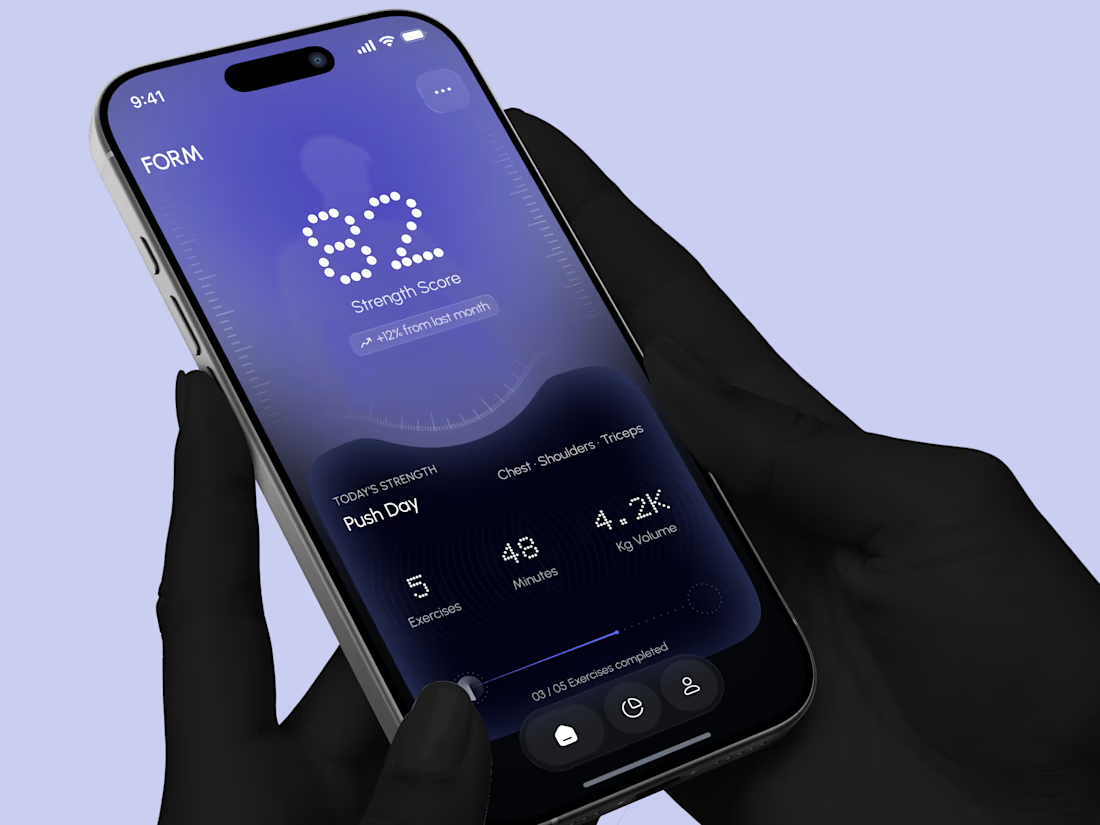
Designed a modern Strength Training Mobile App.
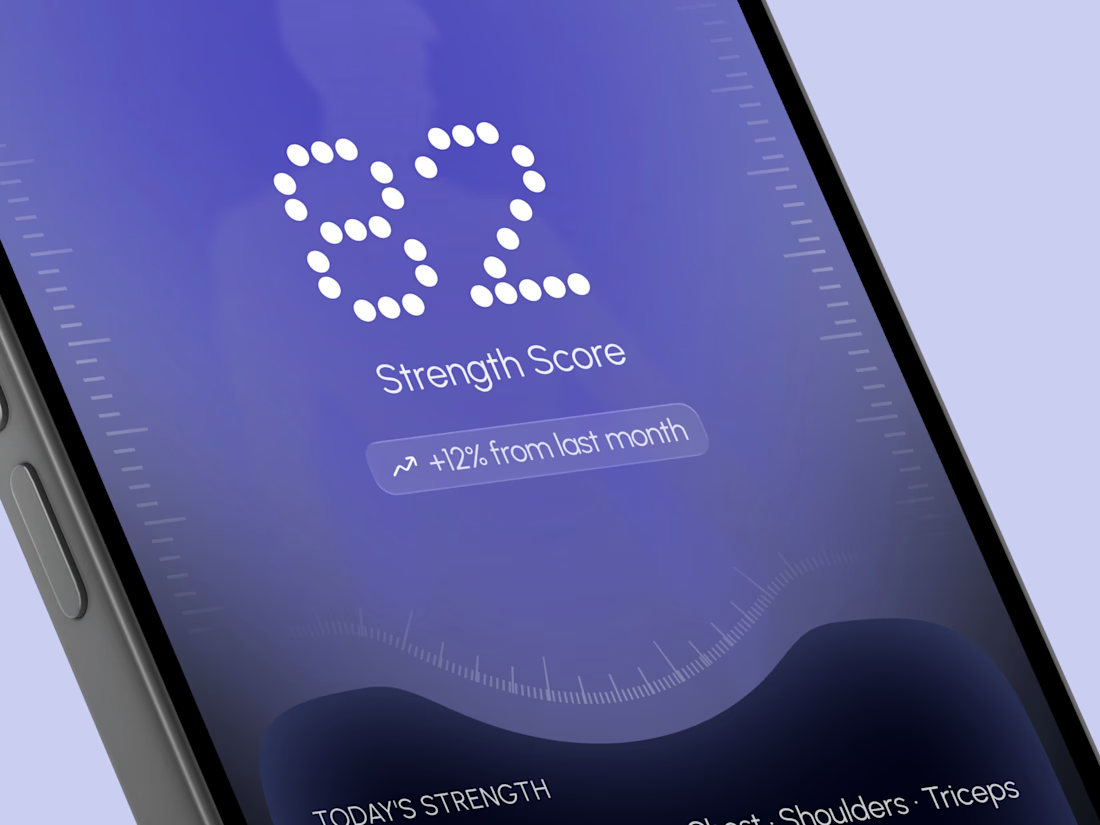
A deep indigo and violet gradient with a soft body silhouette and dotted display numbers for a bold and focused first impression.
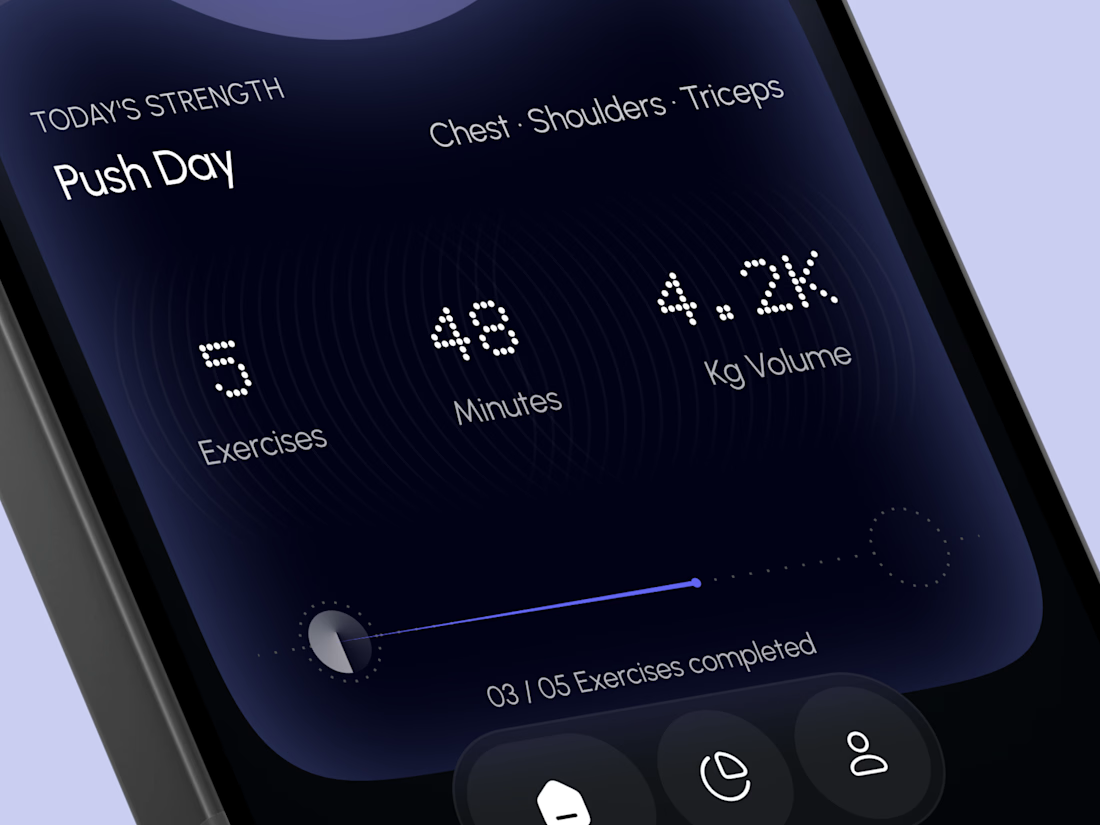
A glowing strength score, a clear workout card with exercises, minutes, and volume, plus a simple progress bar make every training session easy to follow. A curved dark panel, fine tick marks, and a floating tab bar keep the whole app sleek, modern, and easy to use.



High end execution

tiiny.host Landing Page
Description:
A clean, friendly landing page for tiiny.host, the easiest way to put a file online and share it with a link.
The goal was to make the product feel as simple as it actually is. The upload box sits right in the hero, so visitors can drag in a file and get a live link without scrolling or signing up first.
What I focused on:
1. Upload-first hero with a clear “Upload a File” action and file type tabs (Docs, Images, Code, Samples)
2. Hand-drawn illustrations and script accents to keep the tone light and approachable
3. Social proof up top: 500K+ users and logos like Salesforce, Nestlé, and Square
4. Soft sky gradient and plenty of breathing room so nothing feels technical or intimidating

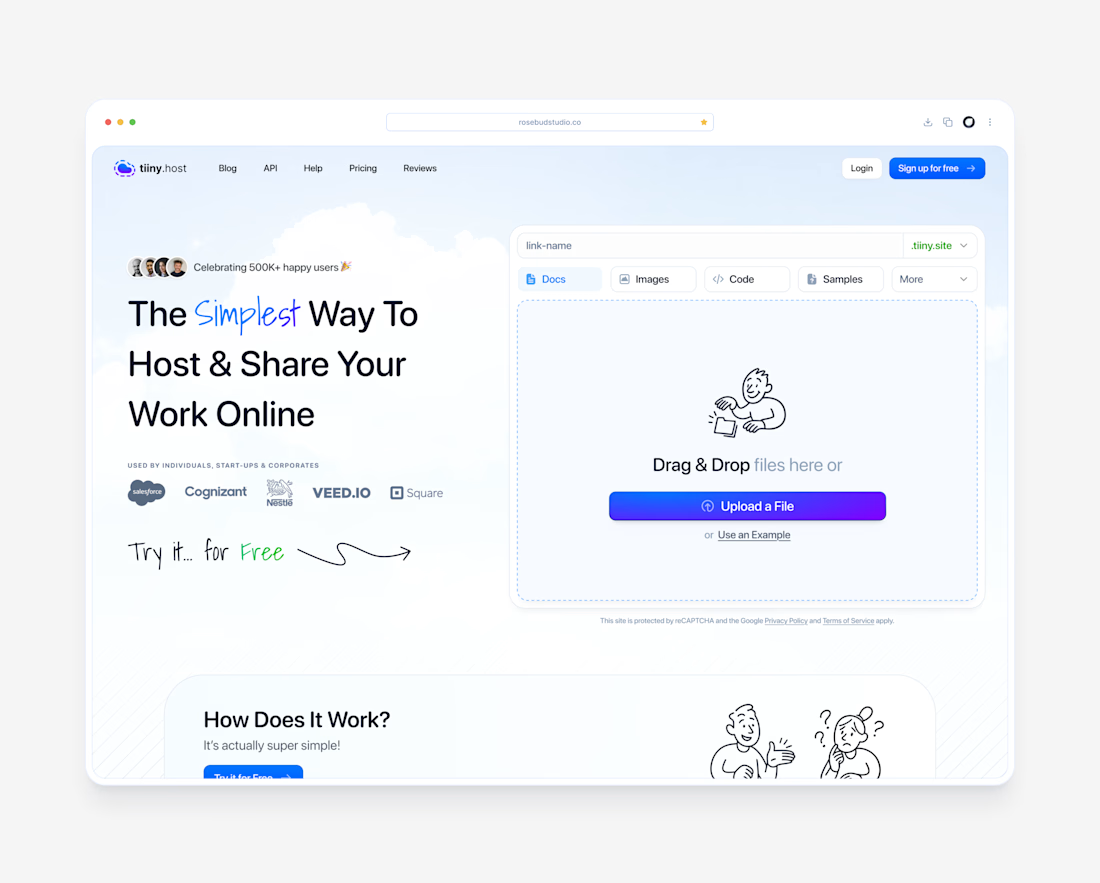

The hand-drawn illustrations with the script accents are what make this landing page special, Dante. They keep a file-hosting tool feeling light and approachable instead of technical, which is exactly the tone the upload-first hero needed.

