The network for creativity
Join 1.25M professional creatives like you
Connect with clients, get discovered, and run your business 100% commission-free
Creatives on Contra have earned over $150M and we are just getting started
Back to feedPost

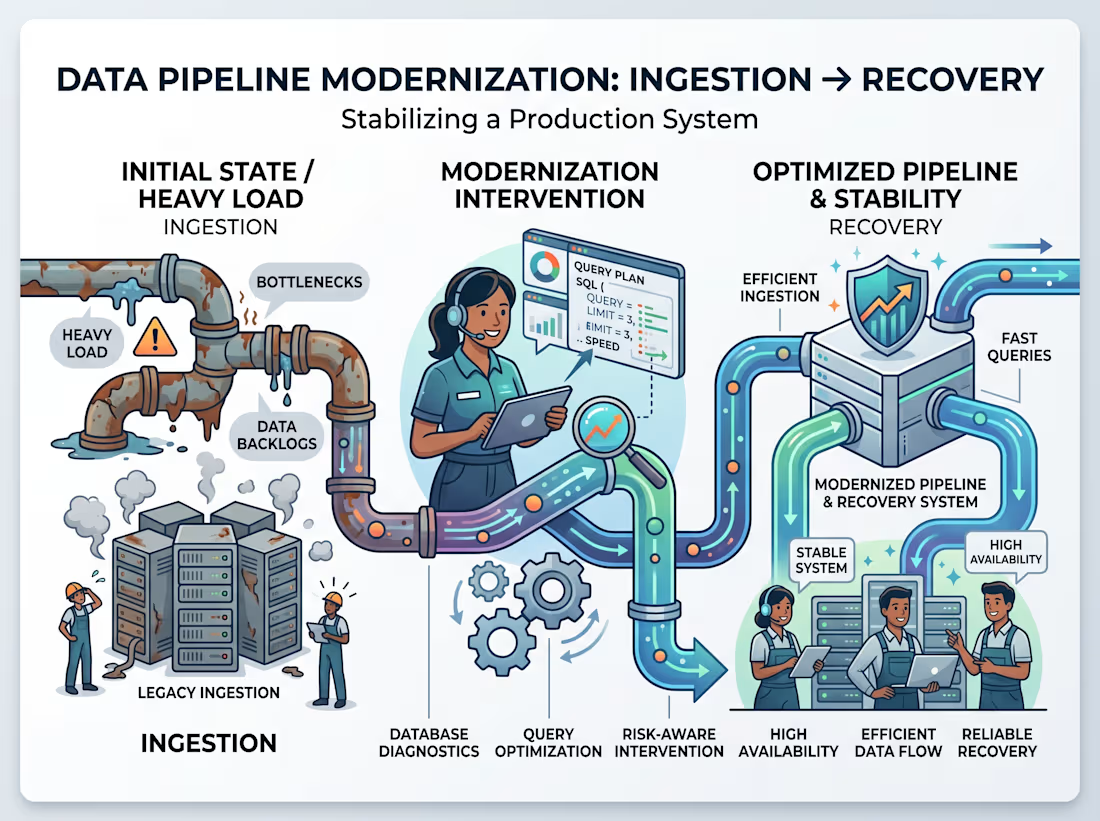
Data Pipeline Modernization
Modernized a brittle analytics ingestion workflow by replacing row-by-row transfer patterns with a more reliable bulk-loading approach. Improved processing speed and operational reliability for large daily data transfers.


The network for creativity
Join 1.25M professional creatives like you
Connect with clients, get discovered, and run your business 100% commission-free
Creatives on Contra have earned over $150M and we are just getting started







Related posts

One business problem. Three analytical routes. One data-driven story. ☕📊
I turned raw business data into actionable decisions—not just another Power BI dashboard.
For the Onyx Data October 2026 Challenge, I worked on the Sunrise Coffee Chain analytics project, analyzing store performance, profitability, customer loyalty, revenue mix, and trading patterns across 60 UK stores (2023–2024).
🔹 My Analytical Approach
1️⃣ Python — Data Preparation
Cleaned and prepared the source datasets to establish a reliable foundation for analysis.
2️⃣ SQL — Business Analysis
Investigated store-level profitability, cost pressure, customer loyalty, revenue contribution, and trading patterns.
3️⃣ Power BI — Interactive Dashboards
Built a 3-page interactive report featuring advanced DAX measures, KPI cards, YoY comparisons, profitability analysis, and business-focused visualizations.
📊 Key Findings
• £89.7M Revenue | £16.9M Net Profit
The business recorded an aggregate net profit margin of 18.8% across the analysis period.
• Store Location Matters
Transport-Hub stores achieved a 25.1% aggregate net profit margin, compared with 18.6% for High-Street stores.
• An Area Requiring Attention
South London Corner recorded a £50.5K net loss over 24 months.
• Product Revenue Contribution
Espresso contributed 45.7% of daily revenue, while food contributed 26.1%.
• Trading Patterns
Average daily revenue was approximately 24% lower on weekends and 33% lower on UK bank holidays than on regular trading days.
💡 My Biggest Takeaway
Revenue alone does not tell the whole story. Understanding profitability, cost pressure, product contribution, and trading patterns helps businesses identify where to improve performance and make better decisions.
🔗 Explore the Complete Project
GitHub: https://github.com/SajeebTheAnalyst/sunrise-coffee-chain-analytics
If you were advising the management team, which finding would you investigate first—and why?
#DataAnalytics #SQL #PowerBI #Python #DAX #BusinessIntelligence #DataVisualization #OnyxData


I would investigate South London Corner first. Break the 24-month loss into store-month revenue, direct costs and allocated costs, then compare it with similar stores over matched trading periods. Reconcile at store-month grain before joining product or loyalty tables so a...

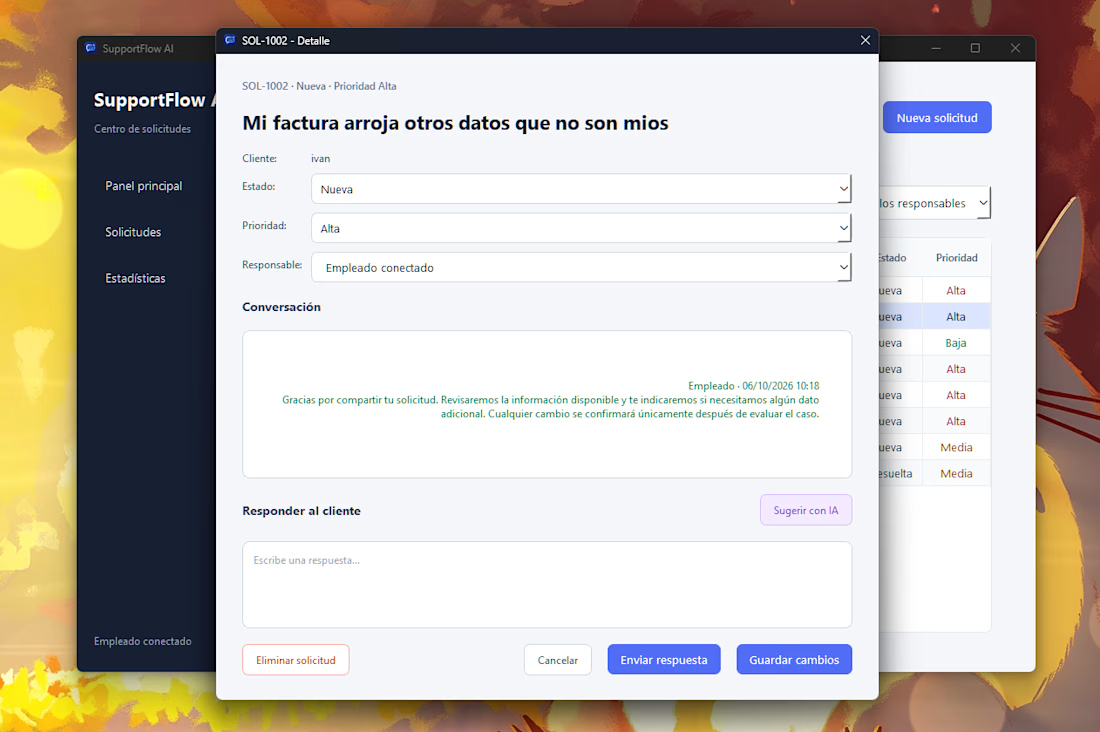
SupportFlow AI is a customer support management system built with Python, PySide6, FastAPI and PostgreSQL.
It helps teams manage customer requests, assign priorities and responsibilities, track conversations, and generate AI-assisted response suggestions while keeping a human in control of the final reply.
I built the application structure, interface, backend integration, database workflows, API layer and automated testing.

The conversation-revision idea sounds useful. I would also check that revision on the server when accepting the send, so a message arriving between review and click cannot slip through. Mark the draft stale while keeping the human edits visible. Two useful regression cases: a...

Agri Guard is a full-stack web application that helps farmers identify plant diseases instantly using AI. Users can upload a photo of an affected plant or describe symptoms in text, and the app returns a diagnosis along with a verified treatment plan.
What I built:
A clean, dark-themed landing page with a hero section, trust badges, feature highlights and clear call-to-action buttons (Get Started, Login to Dashboard)
A Node.js and TypeScript backend with REST API routes, utility modules and environment-based configuration
AI integration for image analysis and text-based diagnosis through the OpenRouter API
A disease database with treatment recommendations, plus scripts to extend it with new diseases
Login and dashboard flow for returning users
My focus: a clear, conversion-friendly landing page, readable typography, consistent spacing and a responsive layout that works on both desktop and mobile.


How do you connect the model's diagnosis to the treatment database? Does it have to match a known disease entry before showing a treatment, or can the model generate recommendations outside that list?