The network for creativity
Join 1.25M professional creatives like you
Connect with clients, get discovered, and run your business 100% commission-free
Creatives on Contra have earned over $150M and we are just getting started
Back to feedPost
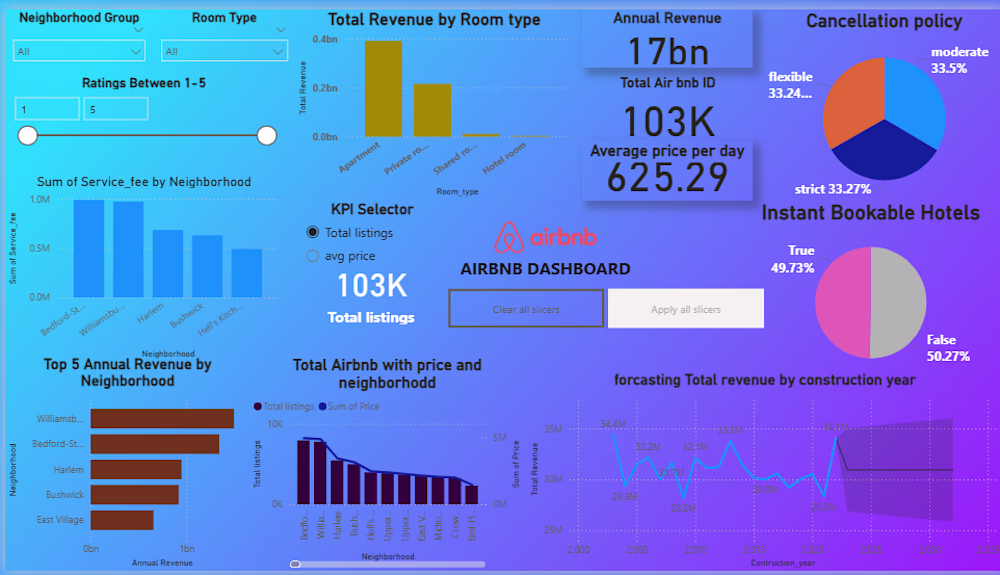
Sales Performance Dashboard
Overview: This Power BI project provides a comprehensive Sales Performance Dashboard to help businesses monitor and analyze key sales metrics. The dashboard consolidates raw sales data into interactive visualizations, enabling decision-makers to track revenue, product performance, and regional sales trends in real time.
thanks Ciro ! really appreciate it🙌
Nice integration of pricing, cancellations, and revenue trends.
Did you model this using a star schema or a flat transactional table? I’ve found forecasting accuracy shifts significantly depending on how booking and cancellation events are structured.
Also curious — was the...
Thanks for the thoughtful questions — really appreciate the feedback.
For this project, I worked with a single flat transactional dataset that captured booking, cancellation, pricing, and revenue fields together rather than separating them into a star schema.
On forecasting, the...
The network for creativity
Join 1.25M professional creatives like you
Connect with clients, get discovered, and run your business 100% commission-free
Creatives on Contra have earned over $150M and we are just getting started
Related posts
Recently I developed this UI, which is a gamified dashboard for students and teachers with neurodiversity accessibility, especially for ADHD users.
The teacher dashboard has more options than the student dashboard, but I think both are neat.
Which one do you like more?
4 voted
67%
2 voted
33%
6 votes
Closed
Really love how you contained the gamified visual elements into that distinct isometric corner widget on the student side. Keeping it completely separate from the core tracking layout is a great way to offer that sense of reward and ownership without adding constant visual noise to the main focus areas.
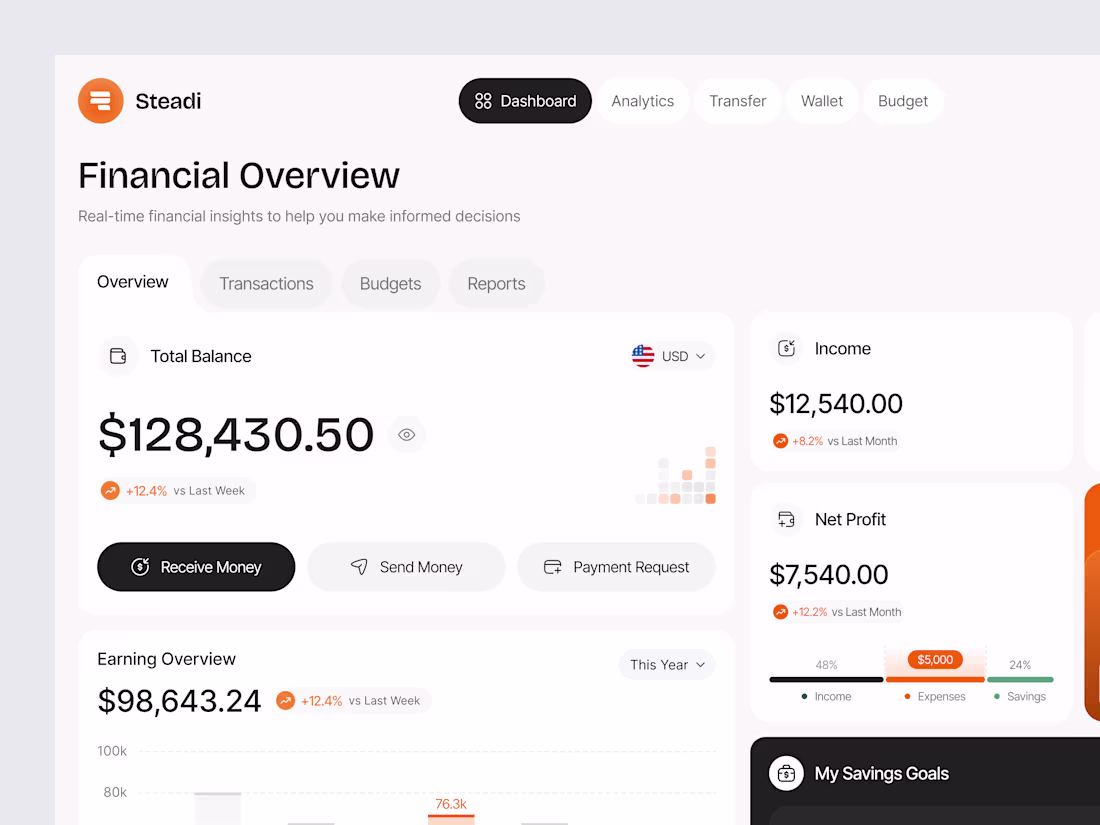
SaaS Dashboard with real-time data visualization 📊
Built with Rive micro-interactions ✨
#wonderchallenge #rive #saas
clean and keen always win
Trending
Claude
Claude has entered the design space. How are you using Claude Design?
Contra University
Learn from expert creatives how to earn more using next-gen AI tools.
fifaworldcup2026
The World Cup is here and the whole world's watching. How are you designing for the world stage?
creativeaiflow
Creative AI workflows are evolving. What tools do you use, and what are their strengths and weaknesses?
freelancerlife
Freelancer life is wins, pivots, and everything in between. What’s yours right now?