The network for creativity
Join 1.25M professional creatives like you
Connect with clients, get discovered, and run your business 100% commission-free
Creatives on Contra have earned over $150M and we are just getting started
Back to feedPost

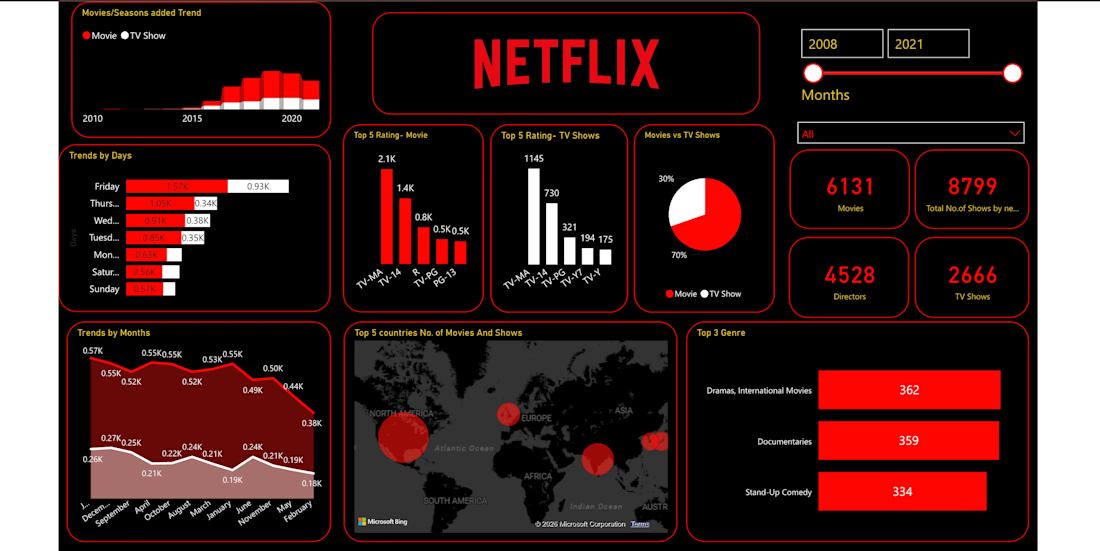
Netflix Content Analysis Dashboard
Overview
This interactive Power BI dashboard analyzes Netflix's content catalog from 2008 to 2021, helping users understand trends in movies and TV shows, content ratings, genres, release patterns, and geographic distribution.
The dashboard enables business users to explore Netflix's library through dynamic filters and interactive visualizations.
Key KPIs
Total Movies: 6,131
Total TV Shows: 2,666
Total Directors: 4,528
Total Titles: 8,799
These KPI cards provide a quick overview of Netflix's content catalog.
The network for creativity
Join 1.25M professional creatives like you
Connect with clients, get discovered, and run your business 100% commission-free
Creatives on Contra have earned over $150M and we are just getting started











Related posts

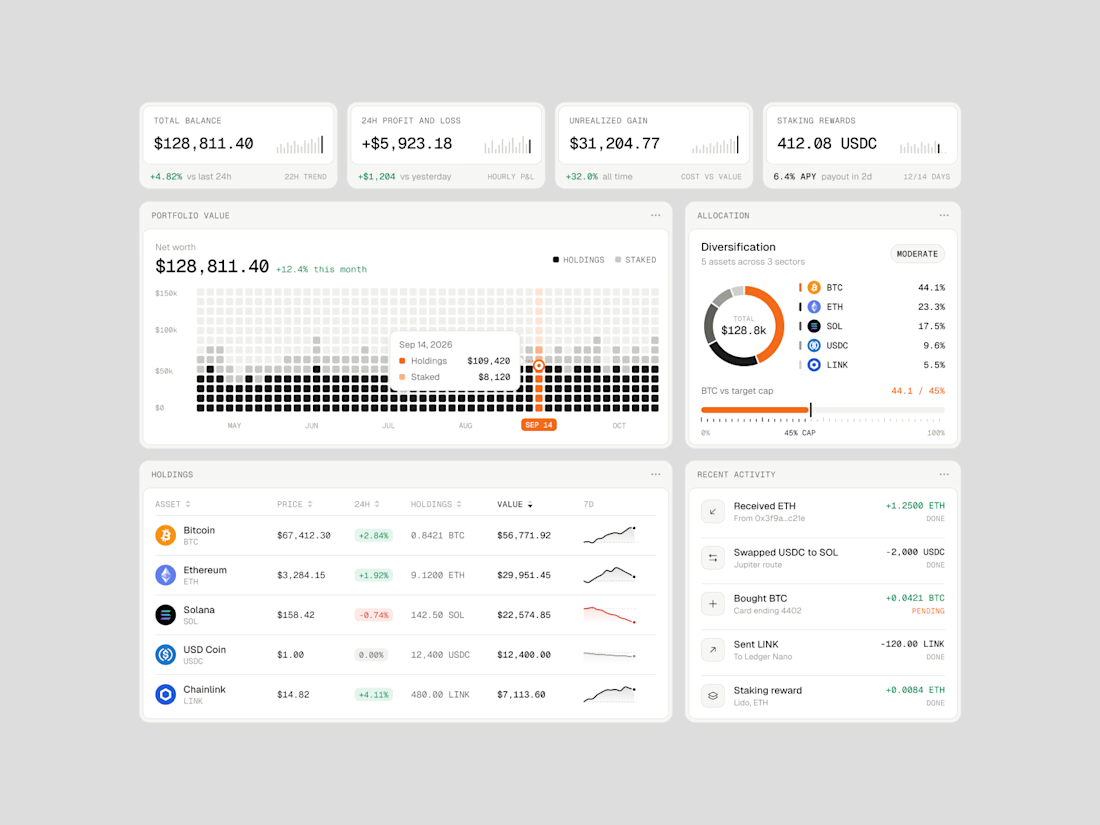
Exploring how complex financial data can feel simple, structured, and easy to navigate.
Vault One is a crypto portfolio dashboard concept that brings together asset performance, portfolio allocation, transaction history, and key financial metrics in one workspace.
I focused on visual hierarchy, information density, and data visualization, using a neutral color palette, subtle UI details, and selective accent colors to keep the interface clean without compromising functionality.
The goal was to make the data easier to understand, not just nicer to look at.
Would love to hear your thoughts on the visual direction and layout!
#ProductDesign #UIDesign #Fintech #DashboardDesign #UXDesign




Exploring a clean, modern SaaS dashboard UI. Focused on simple layouts, smooth interactions, and a better user experience 🚀


i had to like this, it got my attention, very nice build mate.

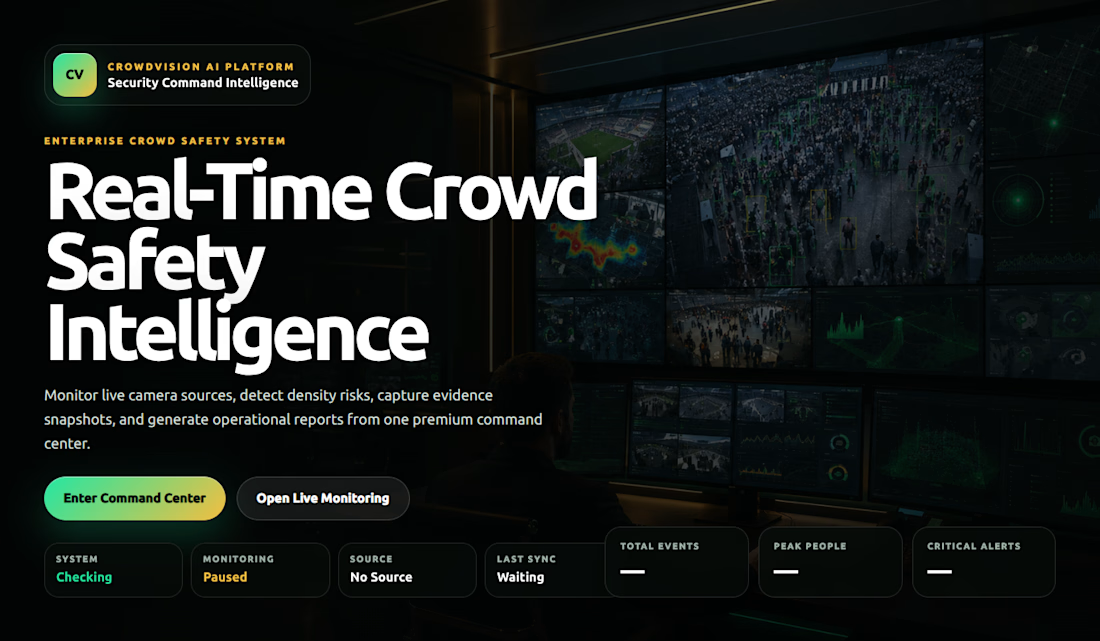
CrowdVision AI – Real-Time Crowd Monitoring & Intelligence System
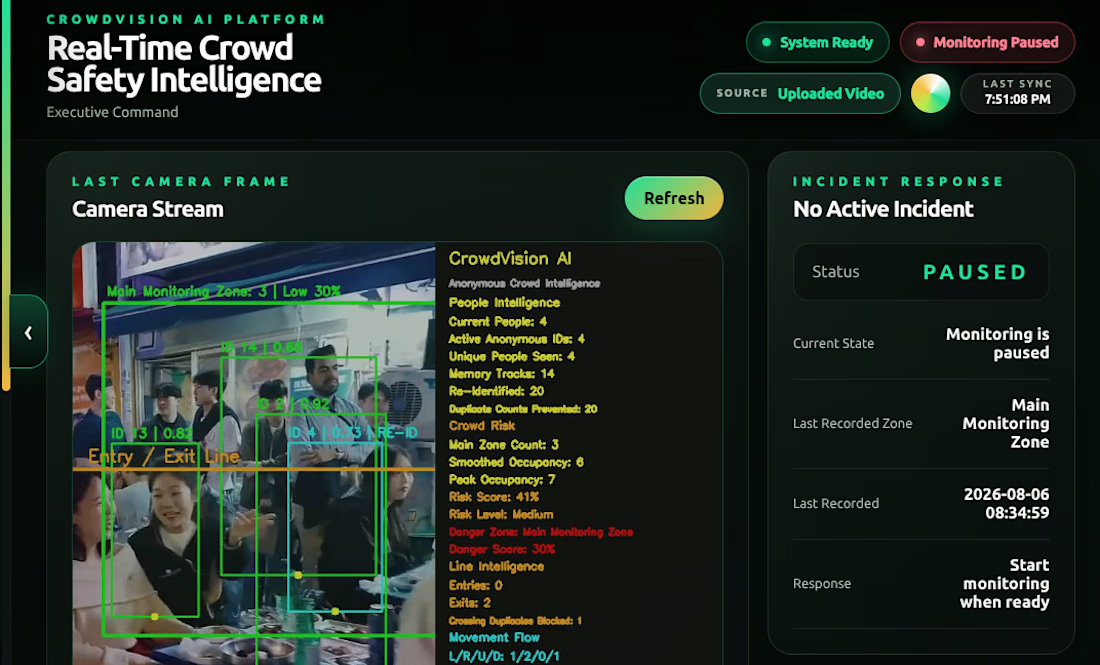
An AI-powered computer vision platform that detects and counts people in real time, monitors crowd density and occupancy, tracks entry and exit movements, and provides actionable crowd intelligence through a live monitoring dashboard.
Overview
CrowdVision AI is an intelligent crowd monitoring and safety analytics platform designed to help organisations monitor public spaces, understand crowd behaviour, and identify potentially unsafe crowd conditions.
The system uses computer vision and machine learning inference to analyse camera feeds and video streams, detect people, estimate occupancy, classify crowd density, and monitor movement across designated zones.
The Problem:
Monitoring crowded environments manually can be difficult, time-consuming, and inefficient. Security personnel may struggle to maintain accurate occupancy counts, monitor multiple zones, and identify unusual crowd conditions quickly.
CrowdVision AI was developed to explore how computer vision and real-time analytics could improve crowd visibility and monitoring.
My Solution:
I developed a computer vision system integrating a pretrained YOLO object-detection model with OpenCV for video processing.
The platform includes:
Real-time people detection and counting.
Crowd occupancy estimation.
Crowd-density classification.
Entry and exit line counting.
Zone-based monitoring.
Incident and anomaly monitoring workflows.
Camera health and tamper monitoring.
Evidence management and reporting.
Telegram alert notifications.
Remote edge camera processing.
Live monitoring dashboard.
Technical Implementation:
Machine Learning & Computer Vision
Python
YOLO / Ultralytics
OpenCV
NumPy
Pandas
Backend:
Python
FastAPI
REST API
Frontend:
React
Vite
JavaScript
Other Technologies
Git
GitHub
Telegram Bot API
JSON/CSV data storage
My Role
Founder & Full-Stack Machine Learning Developer



For entry/exit line counting, I'd test someone pausing on the boundary and stepping back without entering. Do you require a track to move fully between two zones before recording an entry, so small position changes don't become extra visits?