The network for creativity
Join 1.25M professional creatives like you
Connect with clients, get discovered, and run your business 100% commission-free
Creatives on Contra have earned over $150M and we are just getting started
Back to feedPost
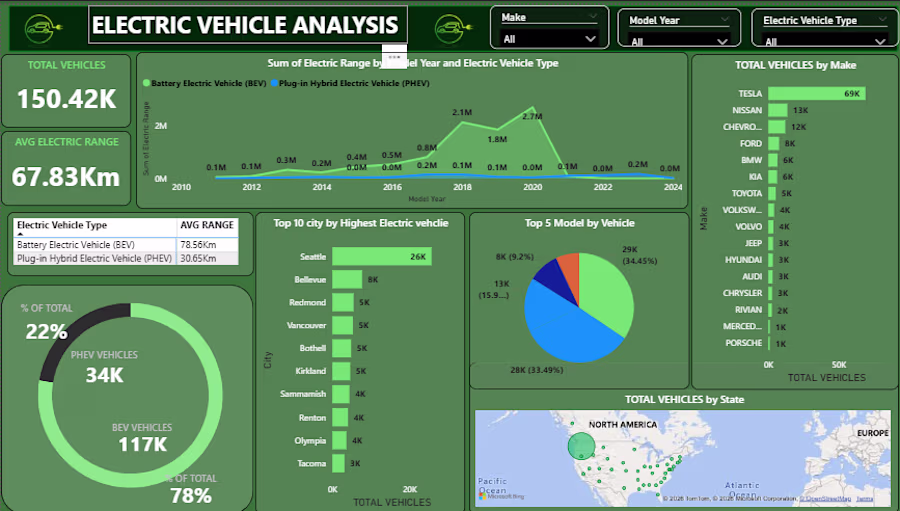
This dashboard provides a quick overview of electric vehicle trends, showing total EV count, average range, and the split between BEVs and PHEVs. It highlights growth over time, top cities and manufacturers, and geographic distribution to understand adoption patterns.
Key Points:
Total EVs: 150.42K with an average range of 67.83 km
BEVs dominate the market (78%) compared to PHEVs (22%)
Strong growth observed around 2017–2020
Tesla leads significantly among manufacturers
Seattle is the top city for EV adoption
EV usage is concentrated mainly in urban regions
The network for creativity
Join 1.25M professional creatives like you
Connect with clients, get discovered, and run your business 100% commission-free
Creatives on Contra have earned over $150M and we are just getting started
Related posts
Evolvoom — Landing Page for an AI Sales & Email Automation Tool
Looks amazing!
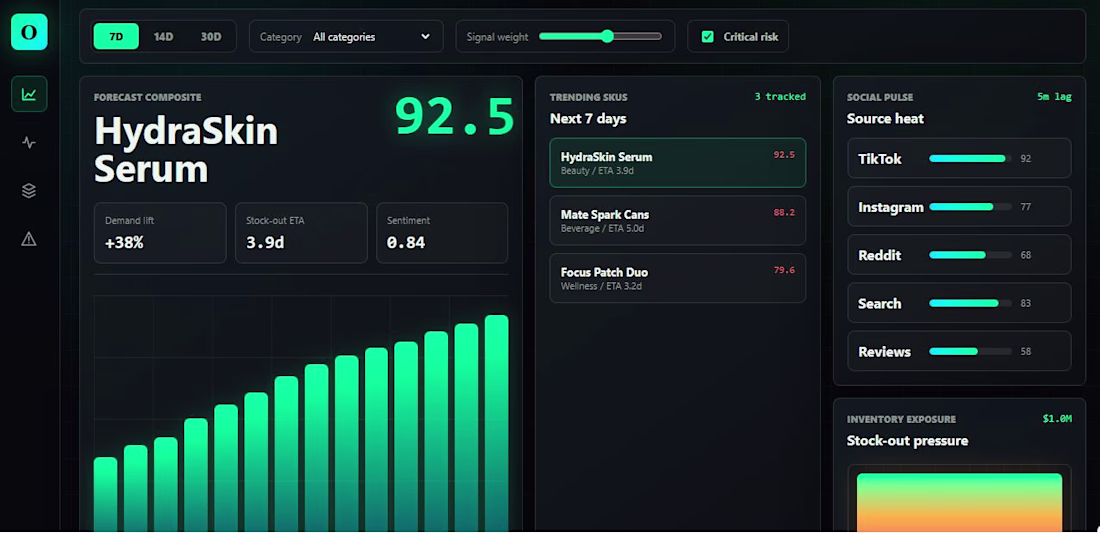
O - A :Predictive Demand & Trend Dashboard
A B2B-focused piece that looks like a high-end trading terminal.
The Experience: A stunning "Bento-grid" dashboard that predicts which products will trend in the next 7 days by scraping social media trends and correlating them with current inventory.
The AI Tech:
Sentiment Analysis: Processing social media feeds.
Forecasting: Using time-series models to predict stock-outs before they happen.
Impressive
A modern real estate management experience designed to make property operations feel clear, premium, and effortless. Built for agencies and property teams handling listings, analytics, appointments, and sales in one unified workspace.
Designed in Figma with a soft neutral interface, bold contrast system, and spacious modular layout that keeps complex property data easy to scan. The dashboard combines performance analytics, interactive property cards, listing management tables, and integrated map tracking into a workflow that feels both elegant and highly functional.
The real strength of the system is flexibility. The same structure can easily adapt for luxury real estate, rental management, hospitality platforms, or property investment tools. From the large visual property showcase to the compact analytics widgets, every section was designed to balance clarity with premium visual presentation.
Really happy with how the monochrome palette and clean spacing helped create a calm, high-end dashboard experience without sacrificing usability.
Would love to hear your thoughts on the UI direction. 👀
UX Design | Real Estate | Dashboard UI | SaaS Platform
Tools: Figma, Jitter
Rock solid layout! 🤘
Trending
Claude
Claude has entered the design space. How are you using Claude Design?
Contra University
Learn from expert creatives how to earn more using next-gen AI tools.
creativeaiflow
Creative AI workflows are evolving. What tools do you use, and what are their strengths and weaknesses?
portfolioreview
The best portfolios tell a story, not just show a grid. Share yours for feedback.
freelancerlife
Freelancer life is wins, pivots, and everything in between. What’s yours right now?