The network for creativity
Join 1.25M professional creatives like you
Connect with clients, get discovered, and run your business 100% commission-free
Creatives on Contra have earned over $150M and we are just getting started
Back to feedPost

Analytics page for B2B platform complex data, simplified for easy decision-making

The network for creativity
Join 1.25M professional creatives like you
Connect with clients, get discovered, and run your business 100% commission-free
Creatives on Contra have earned over $150M and we are just getting started
Related posts

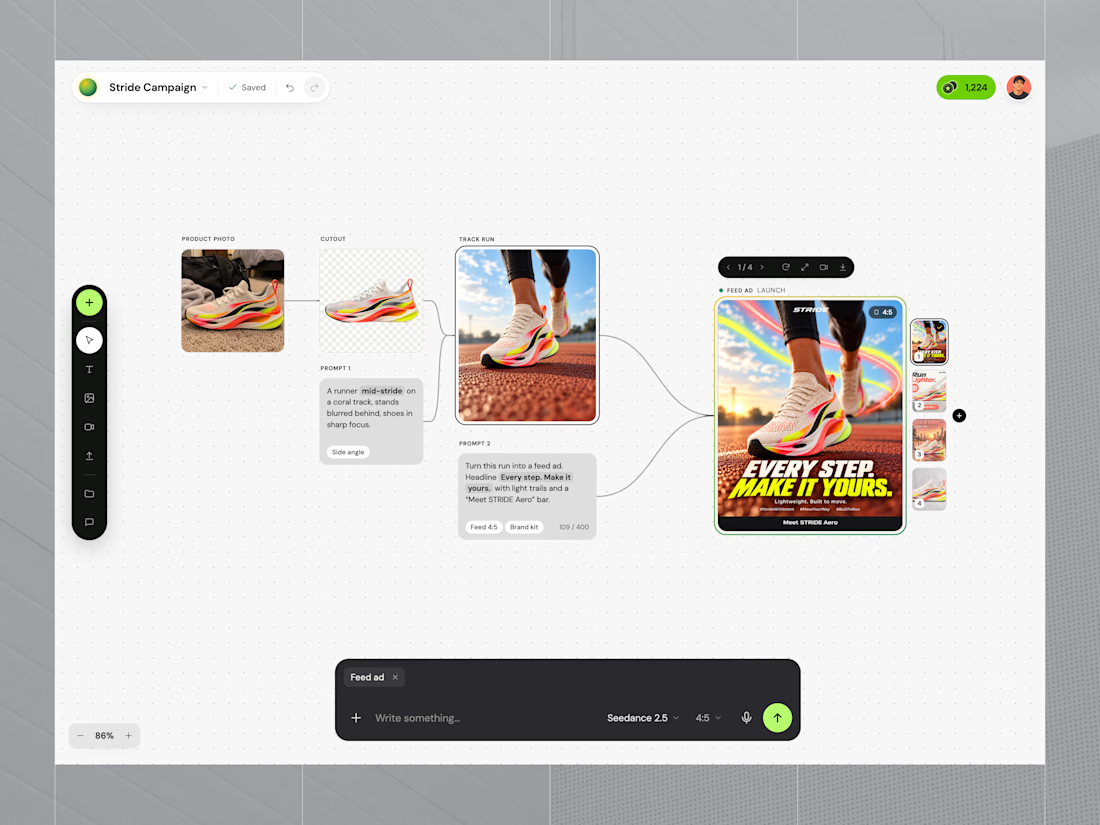
Adloom is an AI-powered canvas that turns one product photo into a complete ad campaign. This shot shows the core canvas: product photo → cutout → generated scene → finished feed ad, with variations, all on one surface.
The problem
Product teams and small brands need a steady stream of fresh ad creative across many sizes. Traditional production is slow and expensive, with shoots, retouching, resizing and approvals. AI image tools help, but they scatter results across chats and tabs, so nobody can tell which prompt made which image.
The solution
A node-based canvas where every generation is connected to its source and its prompt:
Upload anything: a phone photo is enough, and the background is removed automatically
Describe, don’t design: type a scene and choose the model and aspect ratio from a minimal two-line prompt bar
See the whole chain: inputs, prompts and outputs are linked, so iterating is just editing a step
Pick the winner: 4 variations per run, compared side by side
Stay on brand: the brand kit is applied automatically
Ship everywhere: export a full pack (feed 4:5 and 1:1, story, banner, profile, splash) in one click
Impact (target metrics)
Campaign assets in minutes, not days
~80% lower creative production cost
10× more variations for A/B testing
Design decisions
Light dotted canvas, so images stay the focus
One dark prompt bar as the single place to act
Lime accent used only for primary actions and selection
DM Sans throughout for a clean, product-grade feel
My role: product design, UX flow, UI and visual system.

The canvas feels well organised.

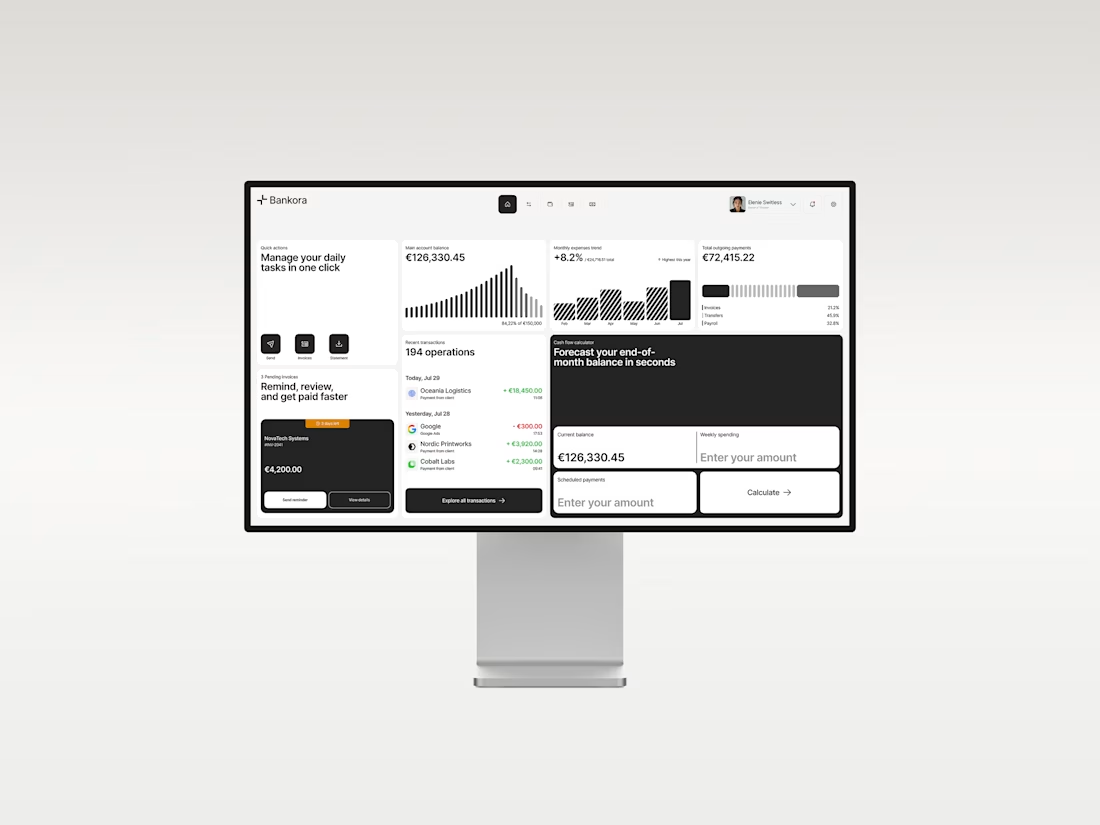
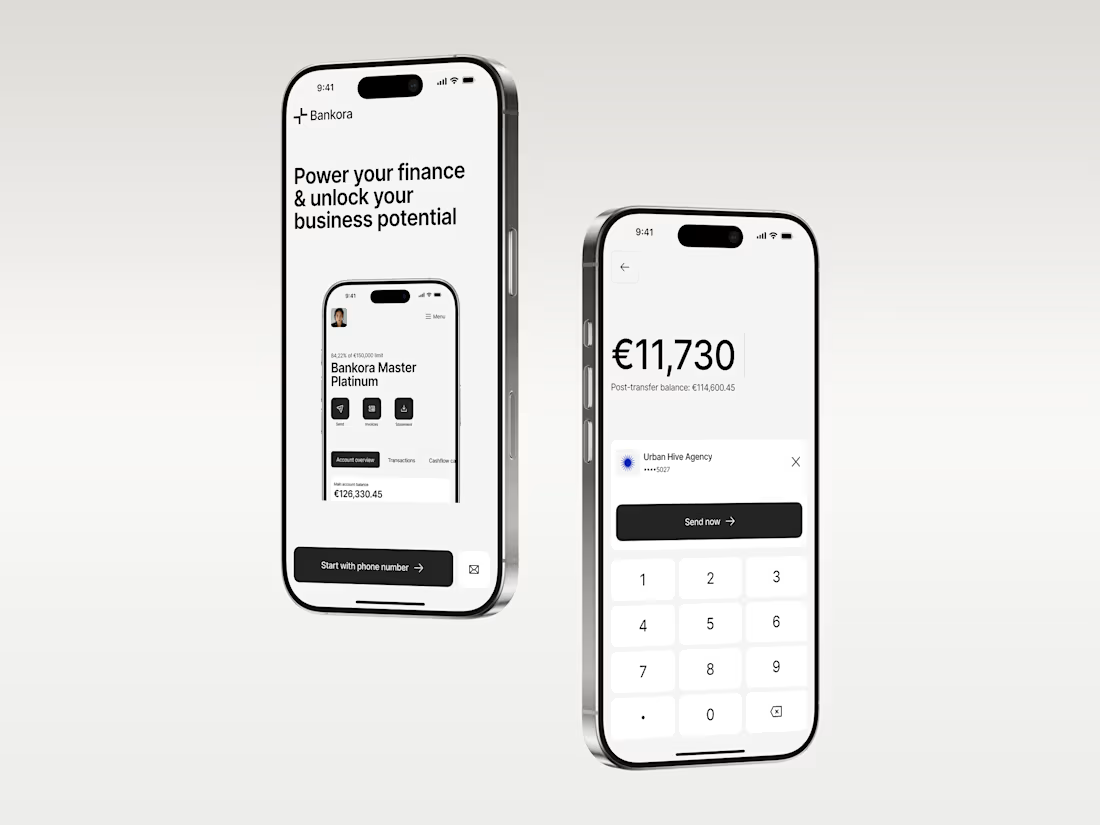
Business banking is already complex. The product shouldn’t make it feel even harder.
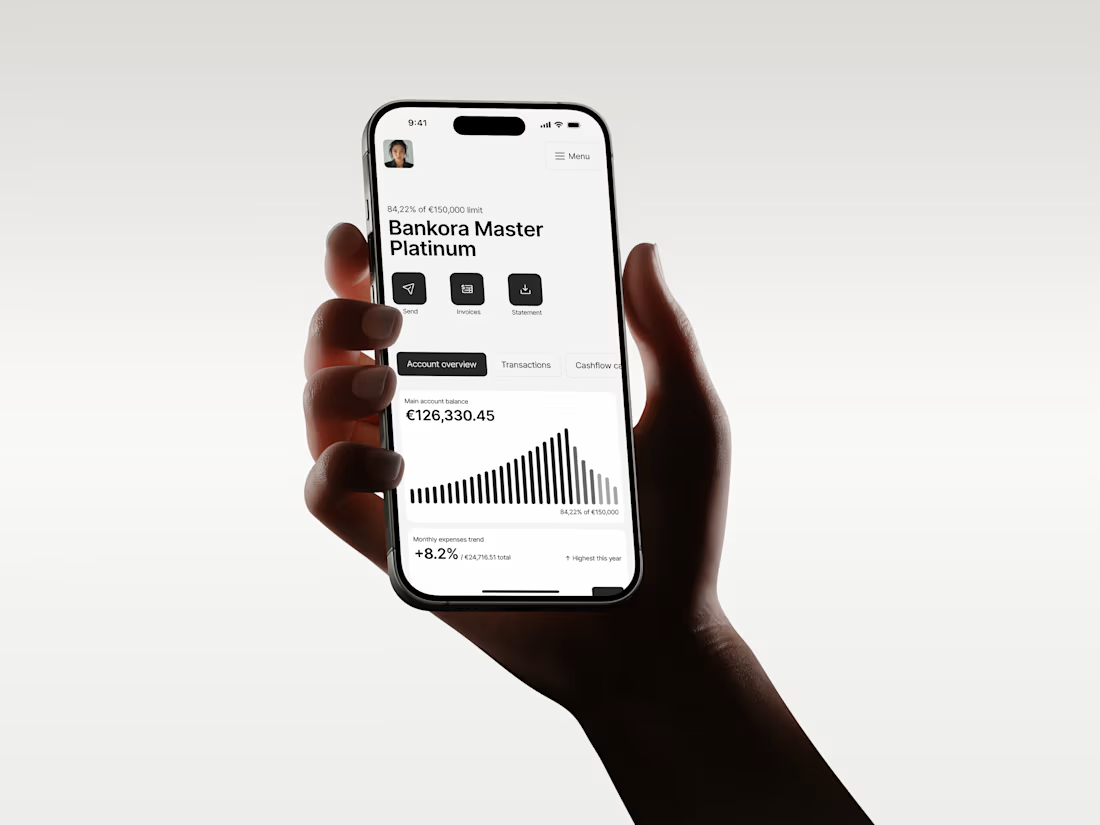
That was the thinking behind Bankora.
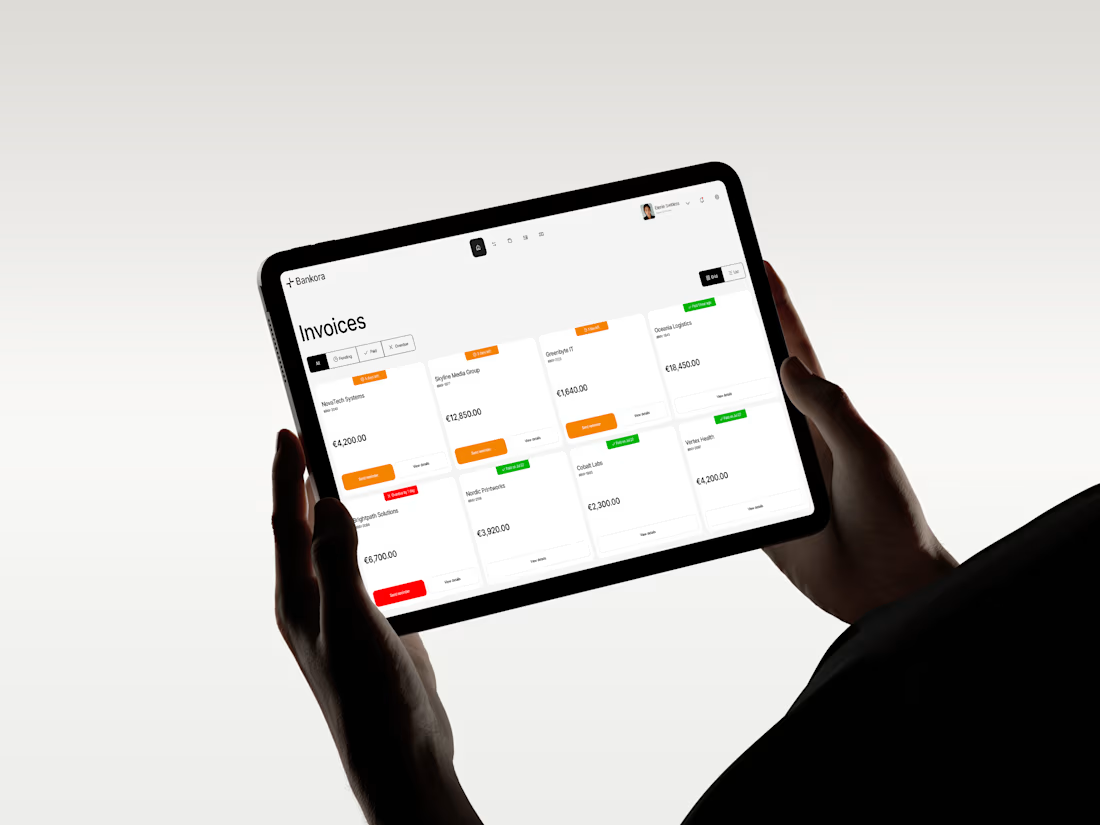
Payments, invoices, cash flow, financial overview. These are things business teams deal with constantly, yet many banking products still bury simple actions under dense data, long paths, and complicated navigation.
So I started with the workflows, not the screens.
I looked at the tasks people need to complete most often, where unnecessary steps appear, and what information actually needs attention first.
From there, I built the experience around clearer priorities: key actions available quickly, predictable navigation, structured financial data, and modular UI that makes things like pending and overdue invoices easier to understand at a glance.
I also designed an interactive cash flow calculator to help users see where the business may be heading, not just what has already happened.
The goal wasn’t to make financial operations simpler than they really are.
It was to make interacting with them feel simpler.
Less searching. Less cognitive load. More confidence in what to do next.
And it was especially nice to see Bankora later featured by Contra.

clean!

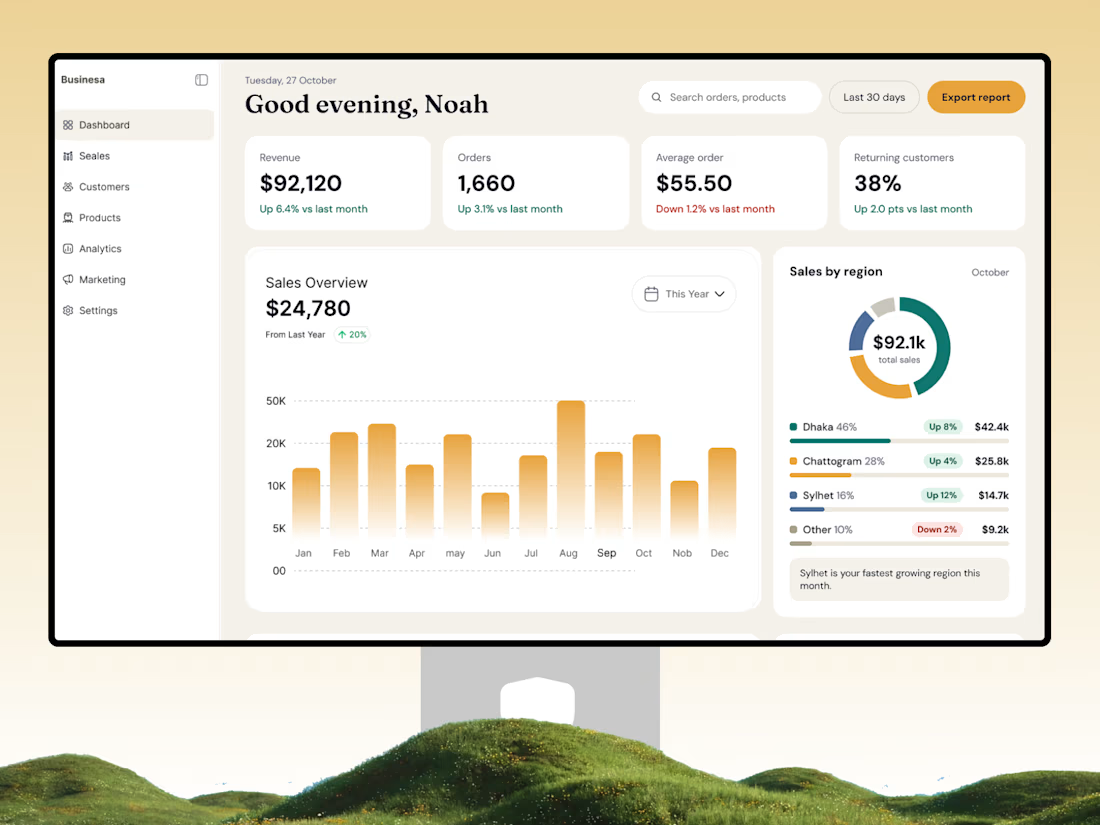
📊 Turn Business Data into Smarter Decisions
A great dashboard doesn't just display numbers — it helps businesses understand performance and make better decisions.
Introducing a modern Store Analytics Dashboard UI/UX Design by OrdainIT, designed for eCommerce businesses that need a clear view of their store performance.
✨ Design highlights:
Clean and intuitive dashboard interface
Revenue, orders, and customer analytics
Interactive sales overview and visual charts
Regional sales performance tracking
Key business metrics at a glance
Organized navigation and user-friendly layout
The goal is to simplify complex business data through a clean, structured, and easy-to-understand interface.
At OrdainIT, we design modern SaaS dashboards and digital products that combine usability with visual clarity.
💬 What's the most important metric you want to see first when opening an analytics dashboard?
#DashboardDesign #UIUXDesign #SaaSDesign #AnalyticsDashboard #ProductDesign #WebDesign #OrdainIT


That serif heading works so well.