The network for creativity
Join 1.25M professional creatives like you
Connect with clients, get discovered, and run your business 100% commission-free
Creatives on Contra have earned over $150M and we are just getting started
Back to feedPost

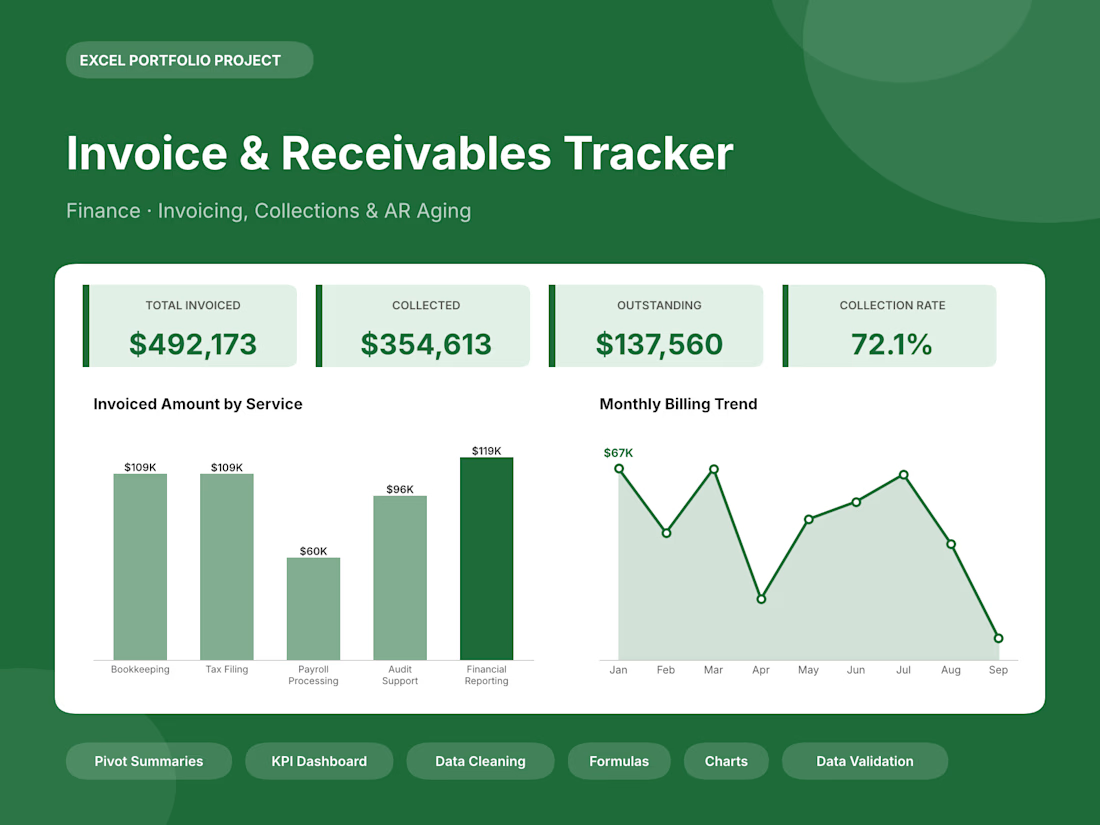
Sample Data - Finance: invoices and receivables, collections and overdue-payment buckets.
Dashboard: a colored title banner, 4 KPI cards, a “Key Highlights” box and 4 charts. The highlights are written by formulas, so they update when the data changes.
Data: 250 records in a filterable table, with drop-down lists, color-coded status cells, bar shading on amounts and calculated columns.
Pivot Summary: 5 summary tables (by category, region, month, status, and so on) with grand totals.
Raw vs Clean: messy sample rows next to a checklist of the cleanup steps. This shows clients the data-entry and cleanup work they’d be paying for.

The network for creativity
Join 1.25M professional creatives like you
Connect with clients, get discovered, and run your business 100% commission-free
Creatives on Contra have earned over $150M and we are just getting started
Challenges
View all


Related posts


technical dashboard

Portfolio sample using fictional customer-order data. I cleaned duplicate rows, standardized dates, phone numbers, city names, amounts, and status values, then documented the changes for easy review. This demonstrates a practical Excel/CSV cleanup workflow focused on accuracy, consistency, and import-ready delivery.

Need help keeping your business finances organized?
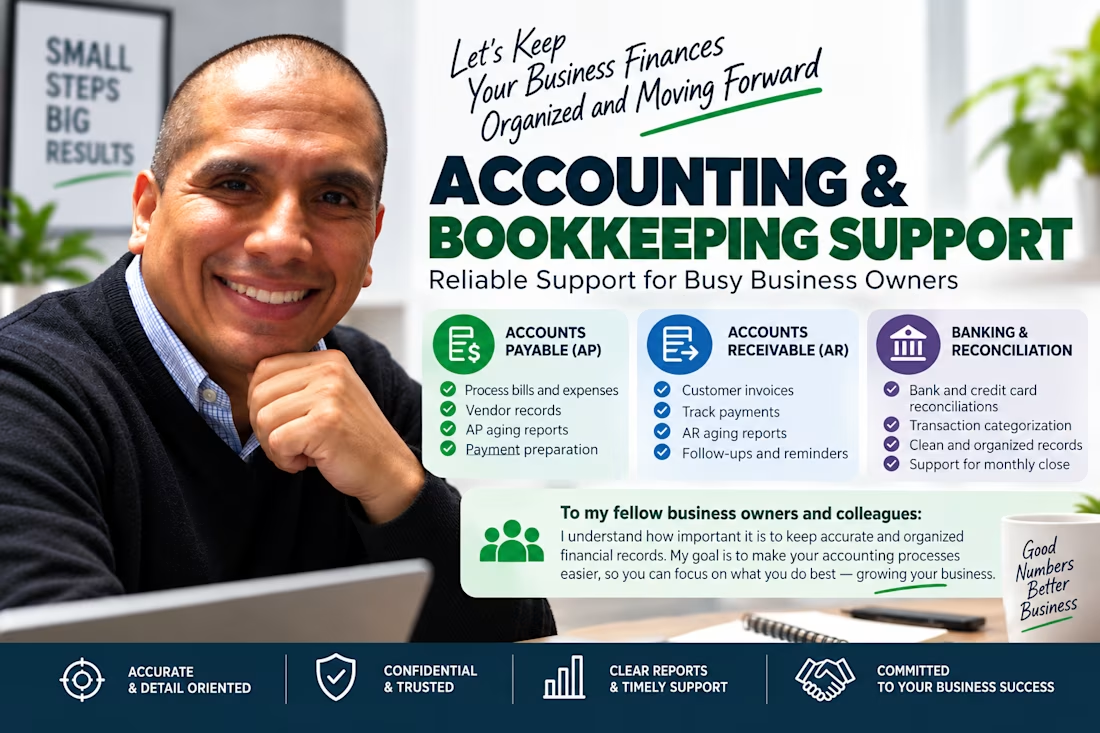
I provide reliable accounting and bookkeeping support to help small businesses maintain accurate records, track transactions, and stay organized.
My services include:
Accounts Payable (AP): Bill processing, vendor records, AP aging reports, and payment tracking.
Accounts Receivable (AR): Customer invoice tracking, payment records, AR aging reports, and follow-up support.
Banking & Reconciliation: Bank and credit card transaction categorization, reconciliation support, and organized financial records.
I work with attention to detail, confidentiality, and a commitment to accuracy and timely delivery. I also have QuickBooks Online training and certification.
To my fellow business owners and accounting professionals: If you need an extra pair of hands to keep your books organized and your accounting processes running smoothly, I'd be happy to connect.
Let's make bookkeeping simpler, one step at a time.