The network for creativity
Join 1.25M professional creatives like you
Connect with clients, get discovered, and run your business 100% commission-free
Creatives on Contra have earned over $150M and we are just getting started
Back to feedPost

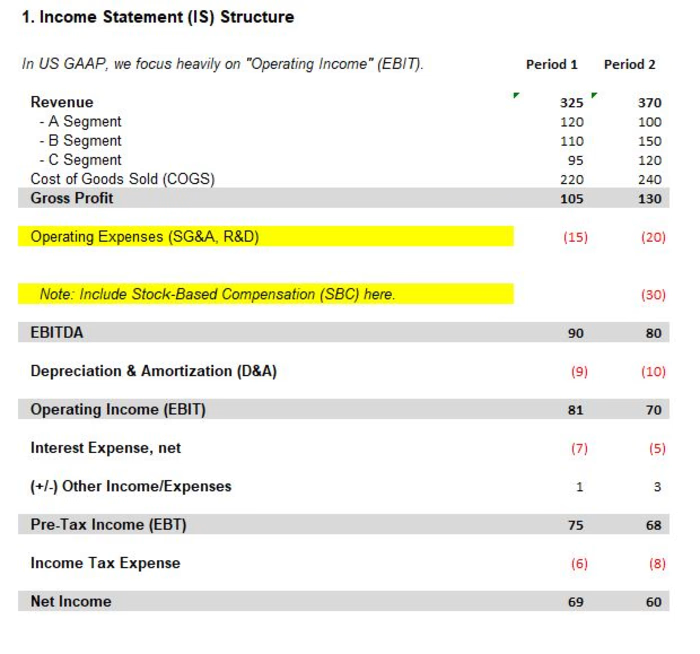
Segment-Level Revenue & OpEx Build
Technical Summary:
Granular Forecasting: Built a revenue model broken down by business segment (A, B, and C) to allow for specific growth and margin assumptions for different product lines.
Profitability Drivers: Analyzed the bridge from Revenue (370) to EBITDA (80), incorporating variable Cost of Goods Sold (COGS) and fixed Operating Expenses.
SBC Integration: Correctly identified and categorized Stock-Based Compensation (30) within Operating Expenses to allow for proper non-cash reconciliation in the valuation phase.
Margin Analysis: Structured the statement to highlight Operating Income (EBIT) as the primary indicator of core business performance before interest and tax effects.

The network for creativity
Join 1.25M professional creatives like you
Connect with clients, get discovered, and run your business 100% commission-free
Creatives on Contra have earned over $150M and we are just getting started





Related posts

Episode 2: Your Numbers Should Make a Sense!
Your sales are growing, but are you actually making more money?
Sales up 40%. Profit down 7%. 😬
Same business, six months later:
Sales: 100K → 140K a month
Profit: 15K → 14K a month
Profit margin: 15% → 10%
More revenue doesn't mean more money. Three things quietly eat the difference:
1️⃣ Margins shrink. Discounts, supplier price rises and delivery costs.
2️⃣ Overheads outgrow sales. Hires, rent and software.
3️⃣ Cash gets stuck. Unpaid invoices and unsold stock.
Track these 3 numbers every month:
✅ Gross margin %
✅ Net profit margin %
✅ Profit vs cash in the bank
Growth without margin is just a busier business.


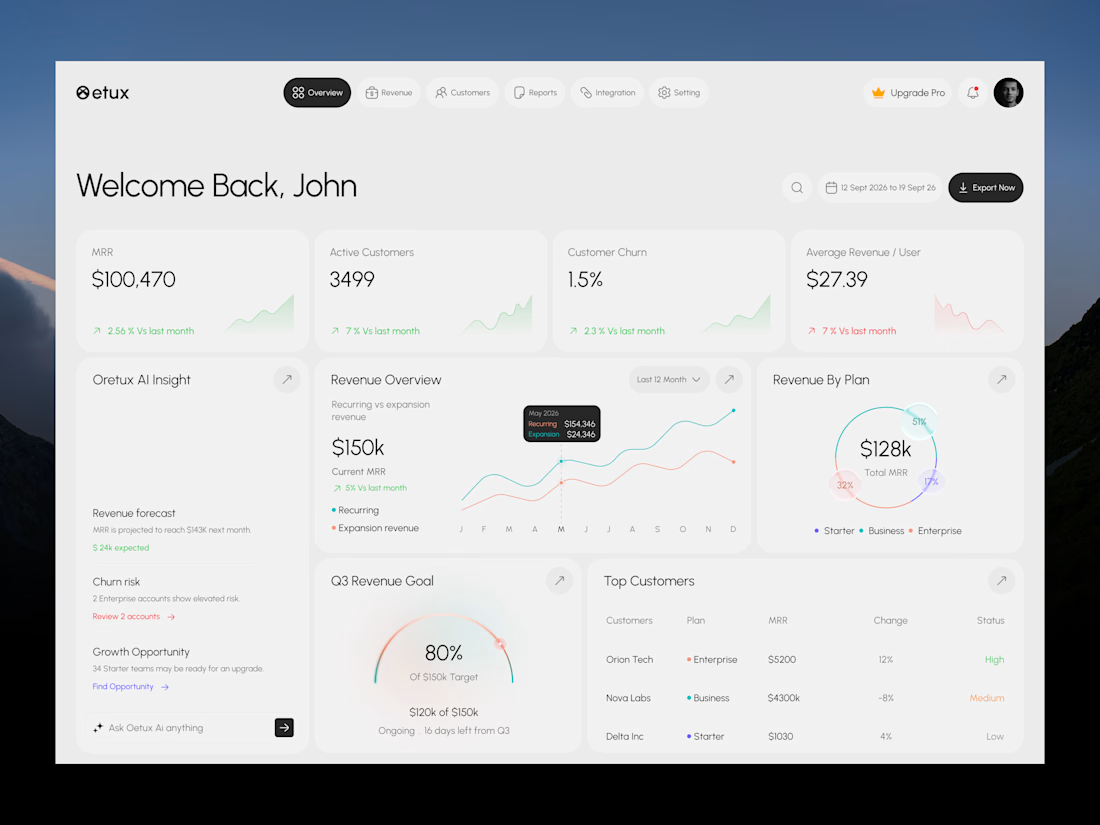
Oetux – SaaS Revenue Analytics Dashboard
The client had a lot of data, but the real problem was making sense of it.
MRR, revenue, churn, active customers, growth, customer performance, goals. Every metric was important, but when everything gets the same attention, users don’t know where to look first.
The existing experience made users spend too much time switching between information and trying to connect the numbers.
So we focused on how SaaS teams actually read their business data. We structured Oetux around the questions that matter most.
How is revenue performing?
Are we growing?
Are customers staying?
Where are we losing revenue?
What needs attention right now?
Then we organized KPIs, revenue trends, customer performance, churn insights, goals, and AI powered insights into one clear experience.
The goal wasn’t to remove data.
It was to organize the data so users could understand it faster.
That’s what we solved with Oetux.
Turning a data heavy SaaS dashboard into an experience that helps teams see their business clearly and make better decisions.



Love the clean layout.

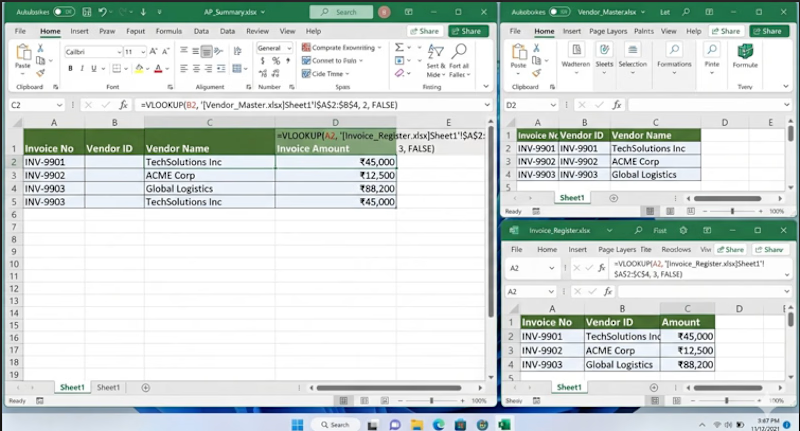
Accounts Payable (AP) Invoice Automation:
The project automates the Accounts Payable process by consolidating separate financial data files.
Using Excel’s VLOOKUP function, it links a central summary sheet (AP_Summary.xlsx) with two source workbooks to automatically fill in missing information. It reads the Vendor ID to pull the matching company name from Vendor_Master.xlsx. It reads the Invoice Number to pull the correct billing total from Invoice_Register.xlsx. This process eliminates manual cross-referencing, cuts down on data entry errors, and instantly creates a unified financial dashboard for efficient invoice tracking and accurate bookkeeping.