The network for creativity
Join 1.25M professional creatives like you
Connect with clients, get discovered, and run your business 100% commission-free
Creatives on Contra have earned over $150M and we are just getting started
Back to feedPost
Taste Test
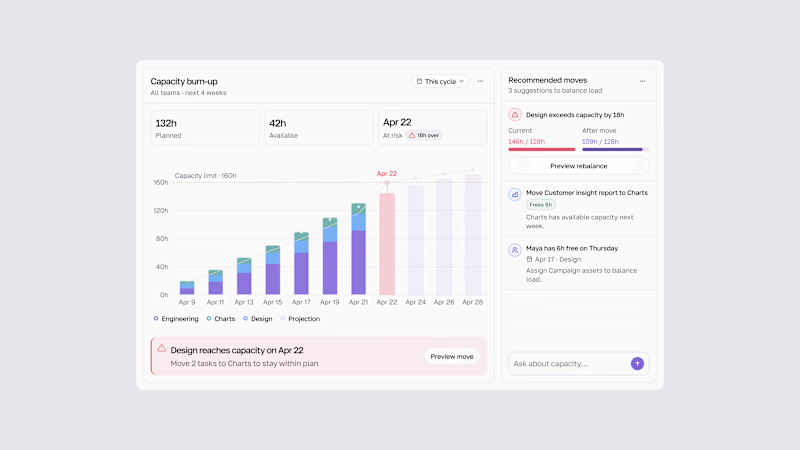
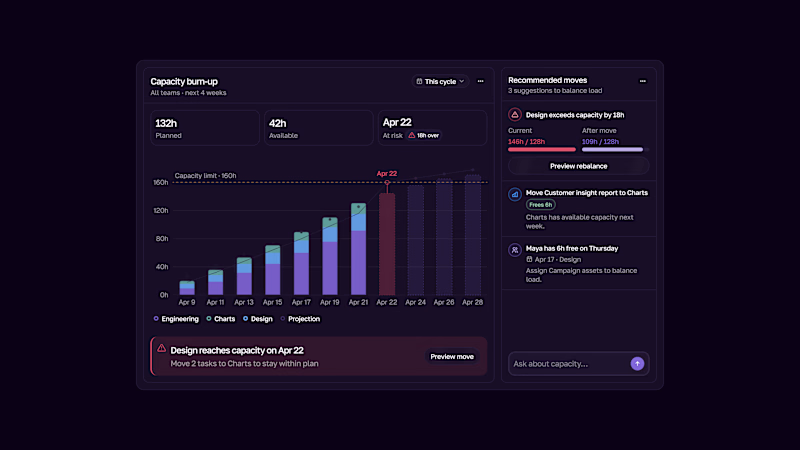
Capacity burn-up UI.
Track team workload, spot capacity risks early, and rebalance work before teams get overloaded.
Light & Dark modes.

3 votes
Ends in 1d

This is the kind of dashboard that actually gets used — the burn-up chart makes overload visible at a glance instead of hiding it in a table somewhere. I like that the point is spotting the risk early, not just reporting it after the fact. Both modes read well, though the dark one makes the chart pop a bit more for me.

Thank you so much for feedback🙌

i think dark one is nice
Thank you🙌

Dark
Thank you🙌
The network for creativity
Join 1.25M professional creatives like you
Connect with clients, get discovered, and run your business 100% commission-free
Creatives on Contra have earned over $150M and we are just getting started



Related posts

Happy to share a little piece of what I've been working on lately: Nexus.
Nexus is a concept for a network that moves money and data as fast as the internet moves information. Payments, tokenized assets, AI agents that pay for things on their own, apps that need privacy by default.
The full website is coming soon.



Big idea and it looks great. Excited to see where you take Nexus next.

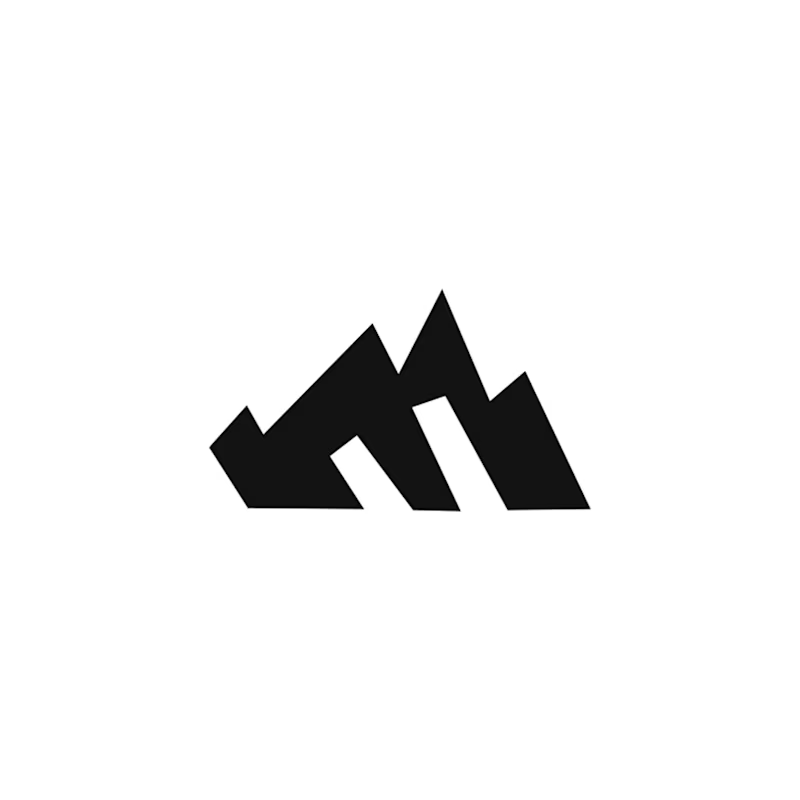
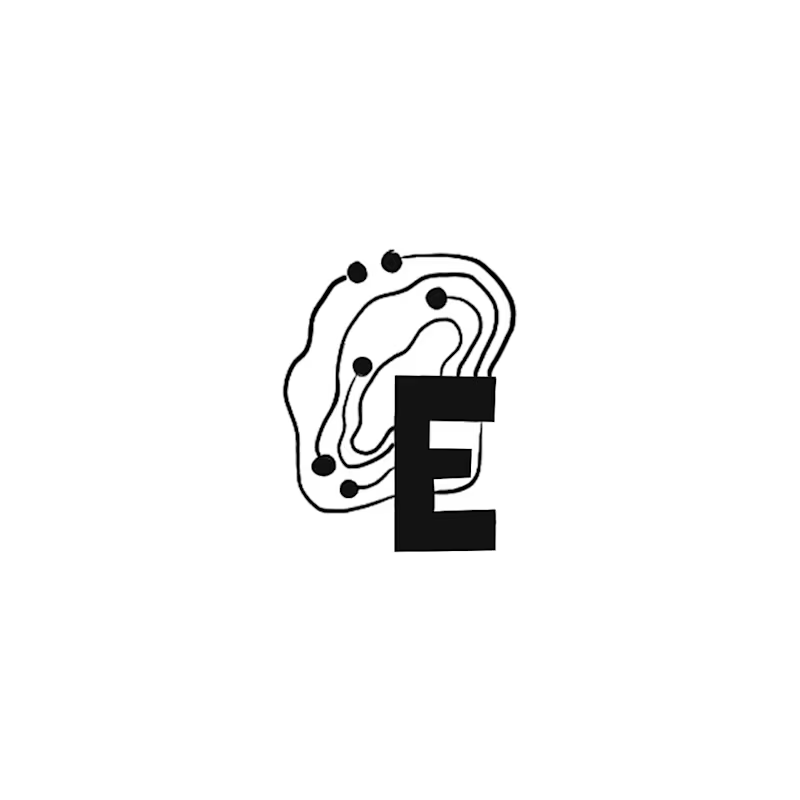
Happy Monday! Exploring early concept marks for a regional IT brand wanting to bridge modern IT services with Appalachian heritage.
Out of 10 sketches, my circle split right down the middle on these two:
A: The Ridge Monogram holds a bold silhouette where the "E" acts as the bedrock of the mountain ridge. It became a fast favorite with non-designer friends.
B: The Topo-Circuit idea plants a dynamic mark pairing circuit traces with elevation contours that can adapt to different locations as the business expands. (My personal pick!)
Which direction would you build out: A or B?
22 voted
73%
8 voted
27%
30 votes
Closed

I like the ridge monogram here!
because it is serving its purpose and it can be use in all applications.
The smallest ones as well.
Great work!🔥

Website & Branding for Blockchain Payments Consortium (Mysten Labs)
