The network for creativity
Join 1.25M professional creatives like you
Connect with clients, get discovered, and run your business 100% commission-free
Creatives on Contra have earned over $150M and we are just getting started
Back to feedPost
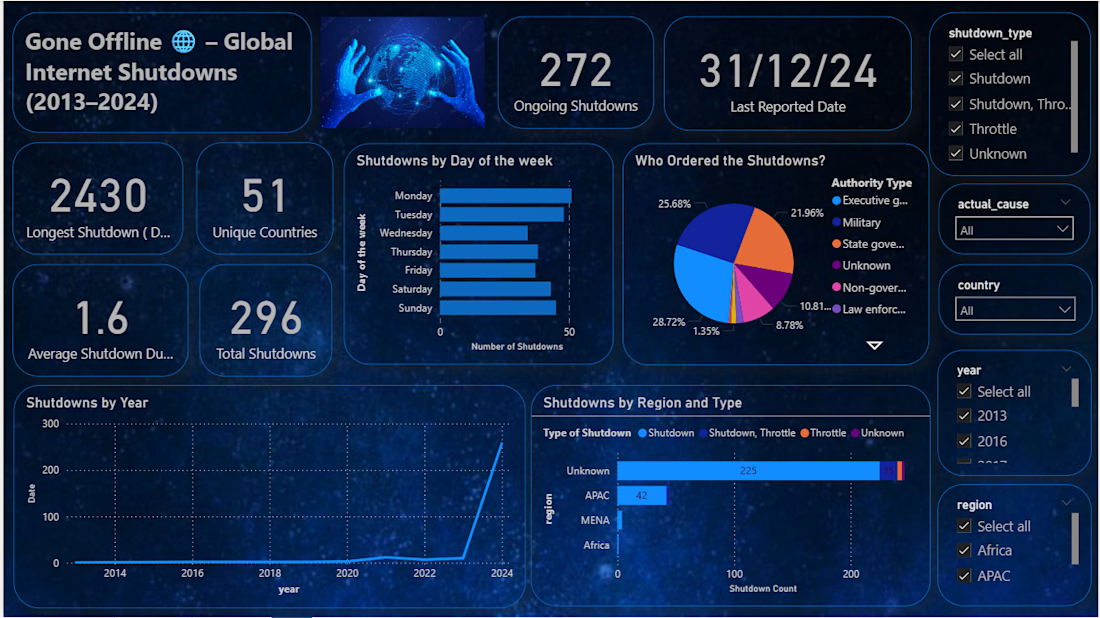
Global Internet Shutdown Analysis
What the project was about:
I analyzed global internet shutdown data to understand where, when, and why shutdowns happen. The goal was to uncover patterns across countries and time periods and highlight their impact on digital access.
What I did:
Collected and cleaned real-world dataset
Performed EDA (Exploratory Data Analysis)
Analyzed shutdowns by:
Country
Year/month
Reasons (political, security, protests, etc.)
Built Power BI dashboards to visualize trends
Identified high-risk regions and frequent shutdown patterns
Key Findings:
Certain countries showed repeated shutdown patterns over time
Most shutdowns were linked to:
Political instability
Government control during protests/elections
Some regions experienced long-duration shutdowns, affecting communication and businesses
There was a rise in shutdown frequency during specific global events
Challenges I faced:
Data cleaning issues
Missing values, inconsistent country names
Unstructured reasons
Different formats for shutdown causes → needed standardization
Time-based analysis
Converting dates and extracting meaningful trends
Visualization complexity
Making dashboards simple yet insightful
How I solved them:
Cleaned and standardized data using Python (Pandas)
Grouped and categorized shutdown reasons
Used time-series analysis for trends
Designed clear and interactive Power BI dashboards
Impact / Outcome:
Provided a clear view of global digital disruptions
Helped identify high-risk regions and key causes
Created dashboards that make complex data easy to understand
This is a very insightful analysis on a highly relevant topic. I like how you handled data challenges like inconsistencies and unstructured inputs and still managed to build clear Power BI dashboards. The findings around political and regional shutdown patterns are particularly interesting.
Thankyou 😊
The network for creativity
Join 1.25M professional creatives like you
Connect with clients, get discovered, and run your business 100% commission-free
Creatives on Contra have earned over $150M and we are just getting started
Trending
Claude
Claude has entered the design space. How are you using Claude Design?
Contra University
Learn from expert creatives how to earn more using next-gen AI tools.
creativeaiflow
Creative AI workflows are evolving. What tools do you use, and what are their strengths and weaknesses?
freelancerlife
Freelancer life is wins, pivots, and everything in between. What’s yours right now?
Related posts
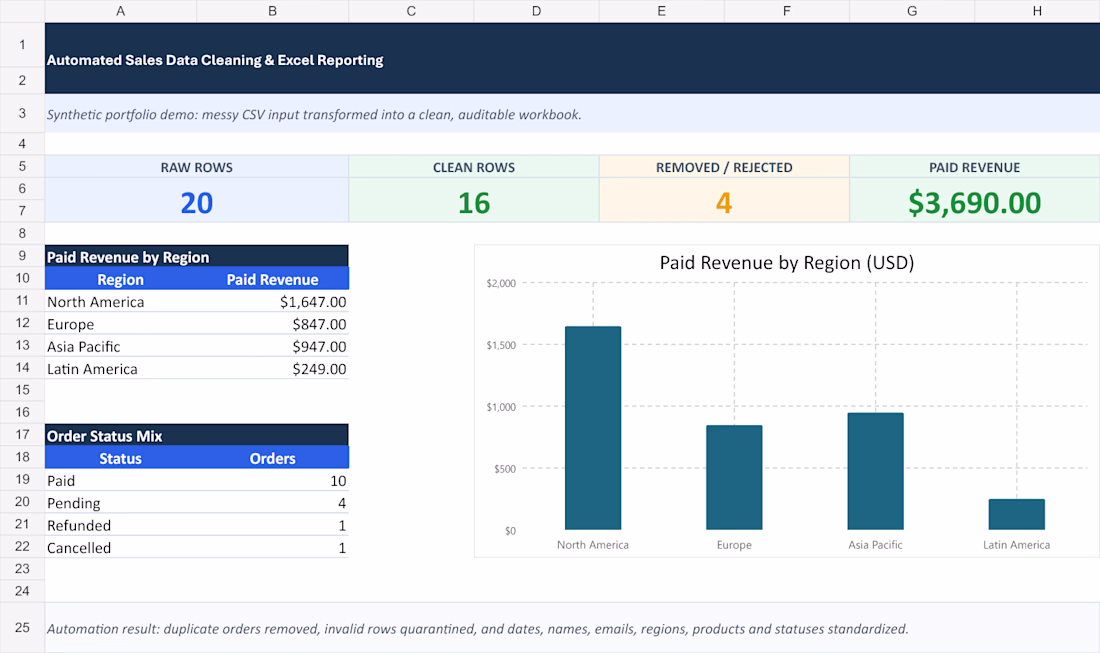
I built a small data-cleaning workflow around one simple rule: bad rows should never silently disappear.
Synthetic demo results:
• 20 raw order records
• 16 clean rows
• 2 duplicates removed
• 2 invalid rows quarantined
• $3,690 paid revenue reconciled
The output includes a clean CSV, a rejected-row file, an audit log, and an Excel dashboard. Dates, names, emails, regions, products, and payment statuses are standardized.
The key design choice is quarantine + reasons, not just dropping bad rows and exporting. That lets a reviewer trace exactly what changed and decide whether rejected records should be repaired.
For recurring exports, what needs the most manual review in your workflow: duplicates, inconsistent labels, or invalid amounts and dates?
Spain won. We couldn't sleep. So we designed instead.
This dashboard concept was born from pure football energy — a spontaneous creative response to championship excitement. No lengthy brief, no full brand system. Just a quick UI exploration that captures the drama and intensity of the game in a clean, data-driven interface.
Sometimes the best work happens when you stop overthinking and just play.
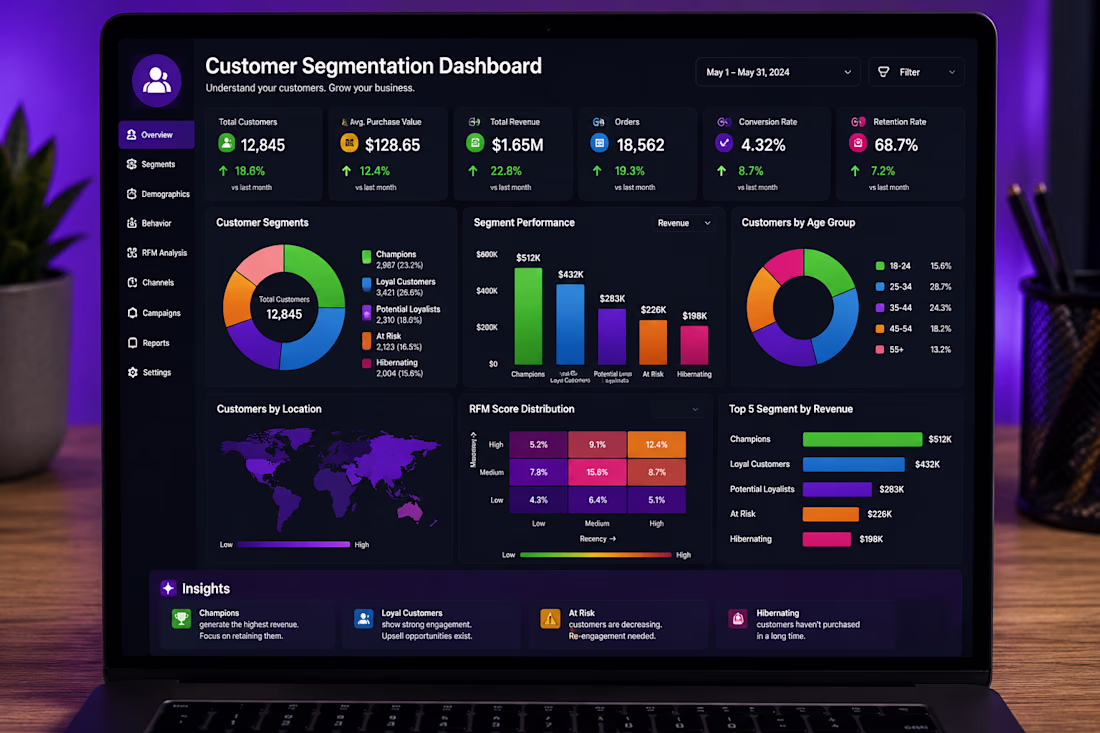
Title:
👥 Customer Segmentation Dashboard
Description:
Built an interactive Customer Segmentation Dashboard to analyze customer demographics, purchasing behavior, customer lifetime value, RFM segmentation, and retention trends. Designed dynamic KPI cards, customer insights, and interactive visualizations using Microsoft Excel, SQL, and Power BI to help businesses identify high-value customer segments and improve marketing strategies.