The network for creativity
Join 1.25M professional creatives like you
Connect with clients, get discovered, and run your business 100% commission-free
Creatives on Contra have earned over $150M and we are just getting started
Back to feedPost

Business Analysis on Hotel Bookings to Maximize Profit


The network for creativity
Join 1.25M professional creatives like you
Connect with clients, get discovered, and run your business 100% commission-free
Creatives on Contra have earned over $150M and we are just getting started



Related posts

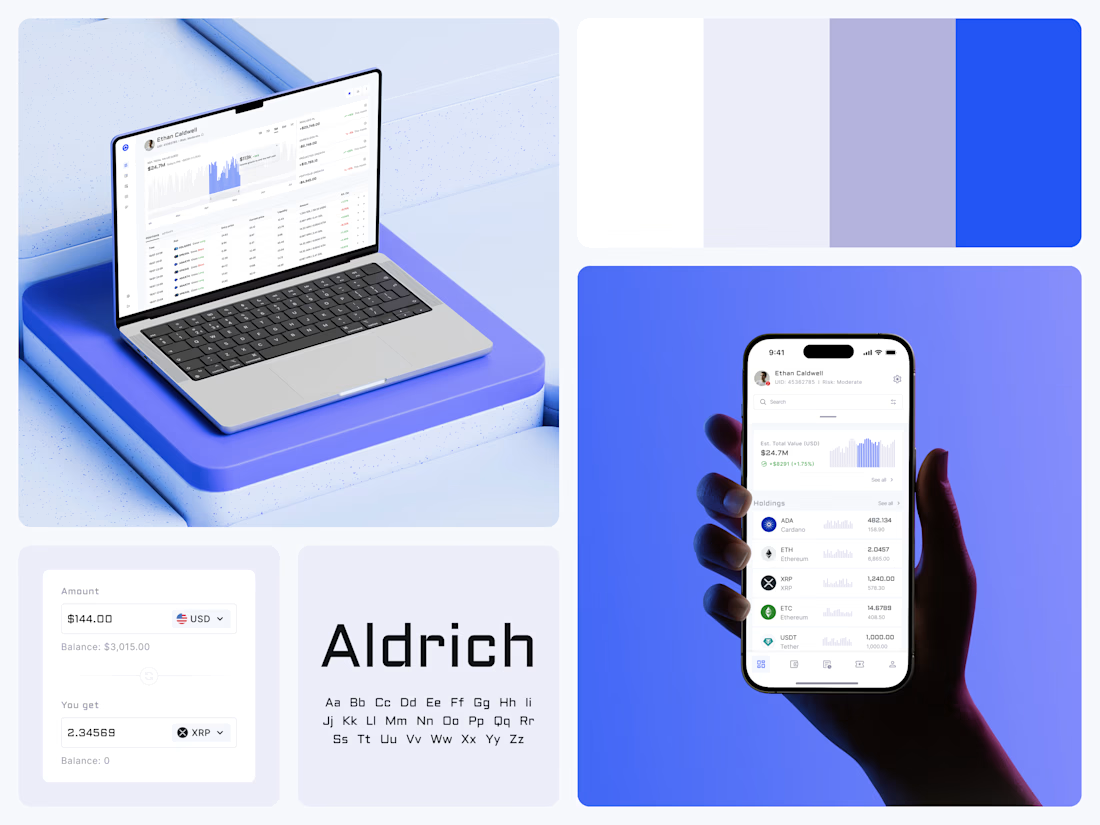
Crypto Portfolio Dashboard
Blue means one thing here: the range you are looking at.
The value chart is a row of thin gray bars, and only the selected date range fills in blue. You read the period that matters and keep the months around it as context.
The phone carries the same chart above the holdings list. Each coin gets its own small bar chart between the name and the amount, so you can scan the whole portfolio for movement without opening a single coin.
Trading screens get busy fast. This one stays light and calm, so the numbers lead: total value, realized and unrealized P&L and open positions, all on one screen.
Designed by the Hue & Machine team.
#Crypto #Fintech #DashboardDesign #TradingPlatform #DataVisualization #UIDesign #ProductDesign #WebApp #MobileDesign #FigmaDesign



Nice Ui Dmytro

I'm testing a $79 report for Shopify merchants who want to see exactly what changed between their original product CSV and a proposed price-update file. It separates intended price changes from changes to other fields, so you can review both before deciding what to do next.
Here's a simple synthetic example: a mug's price changes from $20 to $22 as intended, but the proposed CSV also blanks its Vendor and changes its Status from active to draft. The report lists those differences separately from the price change. This is an invented demonstration, not client work or a customer result.
The proposed $79 report covers up to 1,000 matching products, with one row and one default variant per product, using supported columns only. It uses deterministic comparison with AI-assisted explanations.
This is a read-only comparison. It does not access your store, execute an import, correct files or certify that an import is safe.
Have both CSV files ready for an upcoming price update? Message me on Contra with your product count and intended change, and let me know whether you would request the report at $79 if scope, availability and terms can be confirmed. Start with a description only; don't send confidential files or store access. An inquiry does not place an order or request payment.


Catching accidental changes outside the price column is the part a plain spreadsheet compare never shows clearly. How are you testing the $79 price, DMs to merchants or a landing page?

A swell chart that answers before you read the axis.
Lead with the number people came for, then let the chart back it up. Motion should guide the eye, not decorate.
