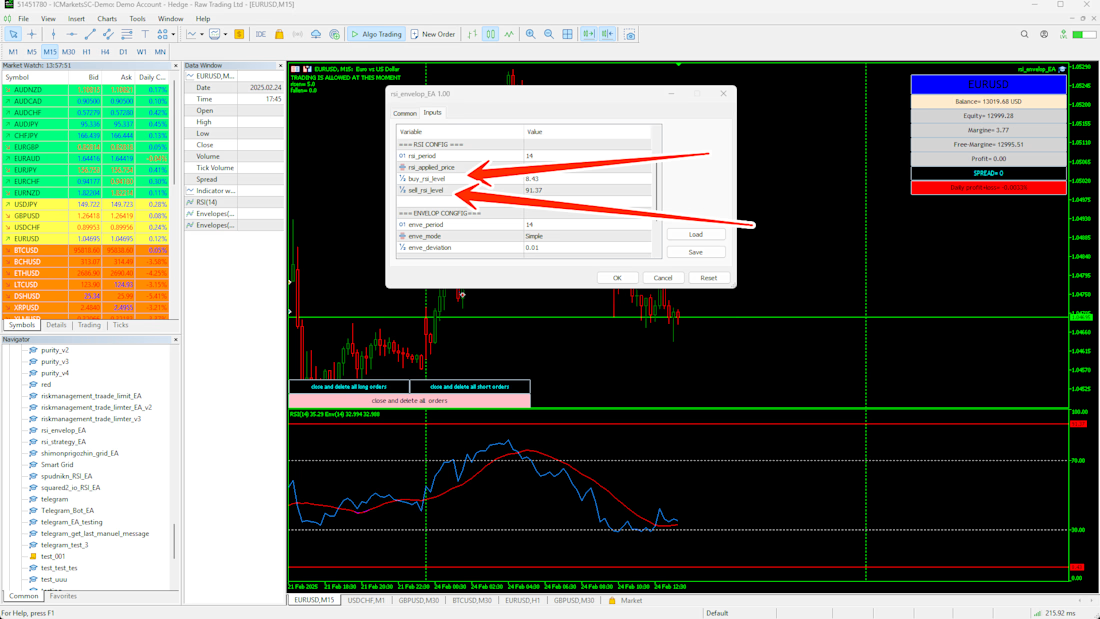
RSI + Envelopes EA designed to capture trade entries under specific conditions using RSI signals combined with envelope breakout and confluence setups.
Prometheus high-cardinality explosion: The hidden telemetry trap that crashes your monitoring cluster precisely when a production incident occurs.
Prometheus and Grafana are the gold standard for production monitoring. Yet almost every scaling engineering organization eventually watches their central Prometheus instance crash with an Out-Of-Memory (OOM) error right in the middle of a high-traffic launch or outage.
The culprit is almost never data volume; it is **uncontrolled label cardinality**.
Here is the exact mechanics of a cardinality collapse:
1. The Unsanitized Label Injection: A developer instruments an API metric: ``http_requests_total{method="POST", path="/api/v1/users/12345/checkout"}``. Instead of grouping by the parameterized route template (``/api/v1/users/:id/checkout``), the raw user ID or transaction UUID is injected into the label. 2. The TSDB Index Churn: In Prometheus's Time-Series Database (TSDB), every unique combination of key-value label pairs creates an entirely new time-series stream. 50,000 unique customer IDs mean 50,000 separate in-memory series heads. 3. The Memory Avalanche: Prometheus maintains an in-memory inverted index of all active series. RAM consumption jumps from 4GB to 32GB in minutes. Compaction fails, WAL (Write-Ahead Log) replays stall on restart, and the entire monitoring node falls into an infinite crash loop.
Engineering a resilient, enterprise observability architecture requires proactive cardinality governance: • Aggressive Metric Relabeling: Use Prometheus ``metric_relabel_configs`` to drop high-cardinality label keys at scrape time before they ever enter the TSDB head block. • Parameterized Path Normalization: Enforce strict application-level middleware that normalizes dynamic URL paths and masks user identifiers before exposing ``/metrics``. • Pre-Aggregating Recording Rules: Calculate expensive rate and histogram metrics (e.g. 5-minute request rates) via recording rules, allowing high-frequency dashboards to query pre-computed series rather than millions of raw samples. • Horizontal Long-Term Storage with Thanos: Decouple real-time monitoring from historical retention. Use lightweight Prometheus sidecars shipping immutable 2-hour TSDB blocks to sovereign object storage (Ceph/S3), querying decades of telemetry via Thanos Query with zero local memory risk.
Your monitoring system must be the most resilient component in your infrastructure—never the first to crash.
Deploy a production-hardened observability telemetry platform with our 1–2 week Sprint on Contra: https://contra.com/s/r6k2QLPl-production-observability-and-sre-telemetry-platform
Why site-to-site IPsec VPN tunnels flap: Complex IKE state machines, dead peer detection timeouts, and stateful connection tracking.
For decades, IPsec (Internet Protocol Security) was the default choice for connecting distributed datacenters, branch offices, and cloud VPCs. Yet almost every network architect has suffered the dreaded 3 AM page: an IPsec tunnel mysteriously dropped, traffic is black-holed, and only a manual daemon restart clears the stale security association.
1. Complex IKEv2 State Negotiations: Phase 1 and Phase 2 negotiations negotiate hundreds of cryptographic proposals (Diffie-Hellman groups, encryption ciphers, hashing algorithms). A single configuration mismatch or transient packet drop during re-keying resets the entire tunnel. 2. NAT & Stateful Firewall Dropping: Stateful border firewalls maintain NAT session tables. When tunnel traffic is idle, stateful firewalls silently purge UDP port 500/4500 session entries, causing subsequent ESP packets to drop without notification. 3. Cryptographic CPU Overhead: Traditional user-space IPsec daemons (strongSwan, Libreswan) context-switch packets across user-space and kernel boundaries, capping throughput on 10GbE inter-datacenter links.
The modern standard is **Kernel-Native WireGuard**, engineered for ultra-fast, stateless site-to-site encrypted meshes: • Stateless Cryptokey Routing: WireGuard eliminates complex multi-phase negotiations. Peers authenticate via static Curve25519 public keys mapped directly to internal IP addresses—similar to SSH authorized_keys. • Zero-Noise Silent Operation: When no traffic is transmitted, WireGuard goes completely silent. It sends zero unauthenticated keepalive noise, resisting network port scanners and automated reconnaissance. • Built-in Persistent Keepalives: A simple ``PersistentKeepalive = 25`` directive maintains NAT firewall pinholes automatically, eliminating stale session timeouts across stateful middleboxes. • In-Kernel Performance: Running inside the native Linux kernel network stack, WireGuard delivers 4x the throughput of OpenVPN and 2x the throughput of IPsec, saturating 10GbE interconnects with minimal CPU load.
Transform your fragile site-to-site connections into an immutable, high-throughput encrypted mesh.
Deploy a zero-trust encrypted network with our 2-week Zero-Trust Remote Access Architecture Sprint on Contra: https://contra.com/s/QocPNgeg-zero-trust-remote-access-and-identity-aware-architecture
KiriTrades — Trading Analytics SaaS
Overview
I designed and built KiriTrades end-to-end as a full-stack trading journal and analytics platform that helps traders track trades, analyze performance, review risk, and identify patterns across multiple accounts and strategies.
Core Features
The platform includes multi-account management, trade imports, broker synchronization, detailed trade journaling, screenshots, strategy organization, rule-based reviews, CSV import/export, and advanced performance analytics.
Architecture
Frontend built with React and Vite, backed by Node.js and Express, with PostgreSQL for application data and JWT authentication. Redis and BullMQ handle asynchronous processing.
Background Processing
Background workers handle broker synchronization, CSV imports, analytics rebuilding, and screenshot processing, keeping longer-running operations outside the main request flow.
Engineering Decisions
I implemented server-side filtering and pagination for growing trade histories, account-scoped data access, authenticated APIs, and targeted analytics updates after trade synchronization.
My Role
Product design, frontend development, backend development, database architecture, integrations, background processing, and deployment — built end-to-end as an independent full-stack project.