The network for creativity
Join 1.25M professional creatives like you
Connect with clients, get discovered, and run your business 100% commission-free
Creatives on Contra have earned over $150M and we are just getting started
Back to feedPost

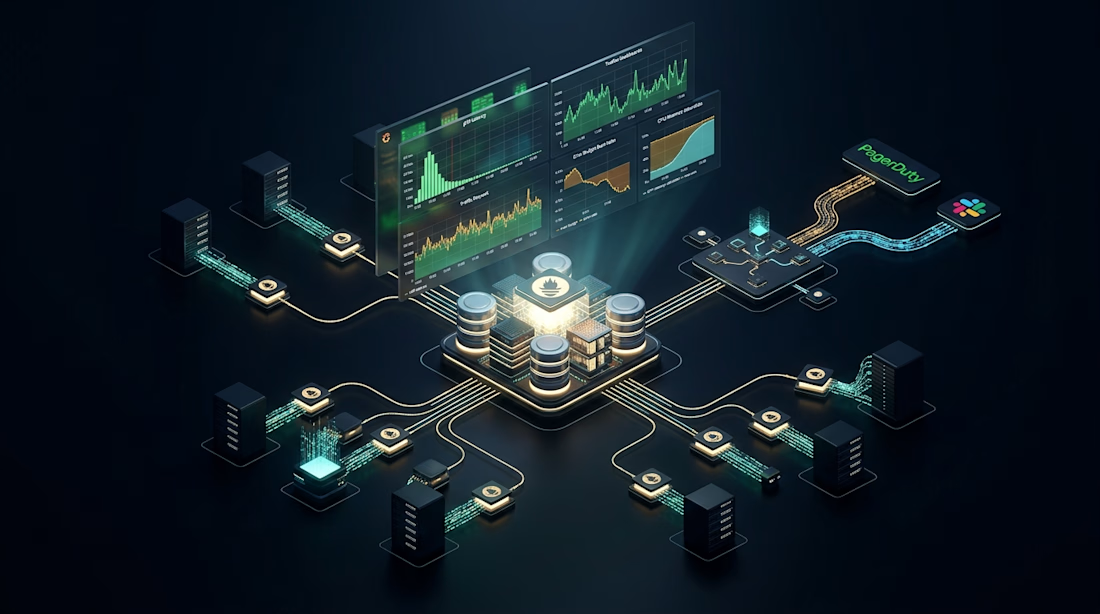
Prometheus high-cardinality explosion: The hidden telemetry trap that crashes your monitoring cluster precisely when a production incident occurs.
Prometheus and Grafana are the gold standard for production monitoring. Yet almost every scaling engineering organization eventually watches their central Prometheus instance crash with an Out-Of-Memory (OOM) error right in the middle of a high-traffic launch or outage.
The culprit is almost never data volume; it is **uncontrolled label cardinality**.
Here is the exact mechanics of a cardinality collapse:
1. The Unsanitized Label Injection: A developer instruments an API metric: ``http_requests_total{method="POST", path="/api/v1/users/12345/checkout"}``. Instead of grouping by the parameterized route template (``/api/v1/users/:id/checkout``), the raw user ID or transaction UUID is injected into the label. 2. The TSDB Index Churn: In Prometheus's Time-Series Database (TSDB), every unique combination of key-value label pairs creates an entirely new time-series stream. 50,000 unique customer IDs mean 50,000 separate in-memory series heads. 3. The Memory Avalanche: Prometheus maintains an in-memory inverted index of all active series. RAM consumption jumps from 4GB to 32GB in minutes. Compaction fails, WAL (Write-Ahead Log) replays stall on restart, and the entire monitoring node falls into an infinite crash loop.
Engineering a resilient, enterprise observability architecture requires proactive cardinality governance: • Aggressive Metric Relabeling: Use Prometheus ``metric_relabel_configs`` to drop high-cardinality label keys at scrape time before they ever enter the TSDB head block. • Parameterized Path Normalization: Enforce strict application-level middleware that normalizes dynamic URL paths and masks user identifiers before exposing ``/metrics``. • Pre-Aggregating Recording Rules: Calculate expensive rate and histogram metrics (e.g. 5-minute request rates) via recording rules, allowing high-frequency dashboards to query pre-computed series rather than millions of raw samples. • Horizontal Long-Term Storage with Thanos: Decouple real-time monitoring from historical retention. Use lightweight Prometheus sidecars shipping immutable 2-hour TSDB blocks to sovereign object storage (Ceph/S3), querying decades of telemetry via Thanos Query with zero local memory risk.
Your monitoring system must be the most resilient component in your infrastructure—never the first to crash.
Deploy a production-hardened observability telemetry platform with our 1–2 week Sprint on Contra: https://contra.com/s/r6k2QLPl-production-observability-and-sre-telemetry-platform
#Observability #Prometheus #Grafana #Monitoring #Infrastructure #DevOps #SRE


The network for creativity
Join 1.25M professional creatives like you
Connect with clients, get discovered, and run your business 100% commission-free
Creatives on Contra have earned over $150M and we are just getting started





Related posts

12Commerce - SaaS Platform | Shopify Alternative 1k+ active users
12Commerce is an AI-powered SaaS eCommerce platform built as a competitor Shopify and WooCommerce for modern businesses and brands. The platform enables users to create and manage online stores with responsive storefronts, WhatsApp commerce, AI automation, inventory management, and intelligent customer engagement tools. Built as a scalable system, the product supports business growth and is generating over $2K+ in monthly revenue.




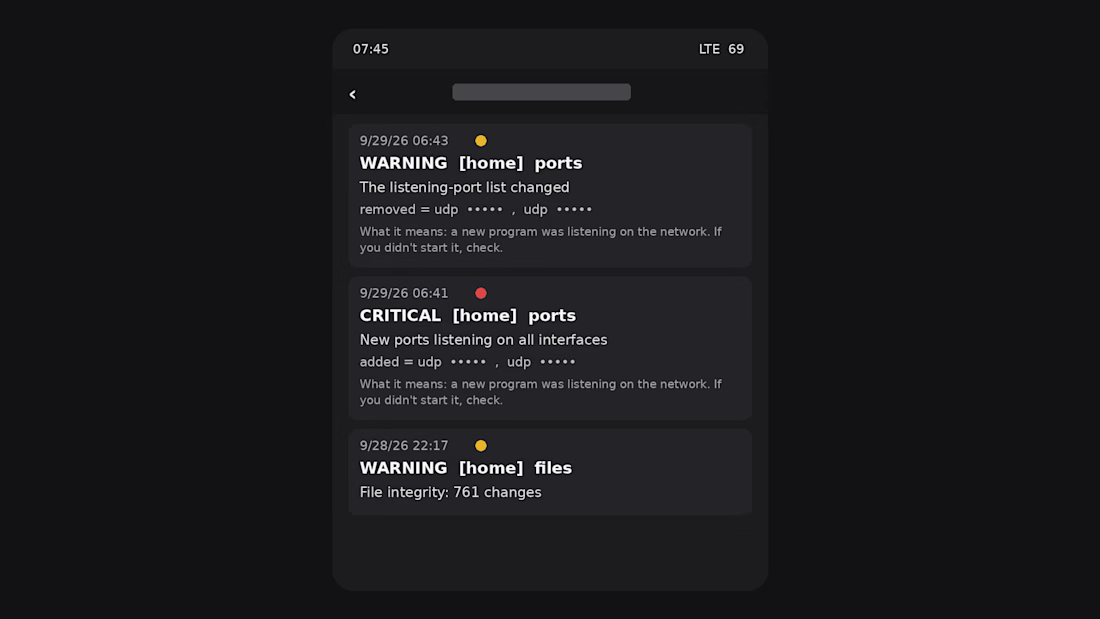
Two alerts came in, two minutes apart. A new port was listening on the server, then the list changed again when it closed. I hadn't touched the machine. I had just woken up.
That's exactly why I built AlfaNest Sentinel.
It doesn't need me staring at a dashboard all day. It watches the infrastructure, detects changes, and tells me when something doesn't match the expected state.
Was it an attack? Not necessarily. It could be a legitimate process, an update, a deployment, or something I simply don't remember starting.
But that's not the point.
A security system shouldn't assume. It should notice. I can investigate the change from there.
Sentinel is an internal AlfaNest Labs system. It's not a product I'm selling. It's simply what I use to keep an eye on my own infrastructure.
Sometimes the best security tools are the ones that wake you up before you know there's something to check.


A self-initiated dashboard concept for a B2B growth analytics platform, built around one core idea: transforming complex data into instant visual clarity. Most SaaS dashboards overload users with walls of raw numbers. PulseMetrics turns dense retention metrics into sleek, actionable insights in seconds

