The network for creativity
Join 1.25M professional creatives like you
Connect with clients, get discovered, and run your business 100% commission-free
Creatives on Contra have earned over $150M and we are just getting started
Back to feedPost

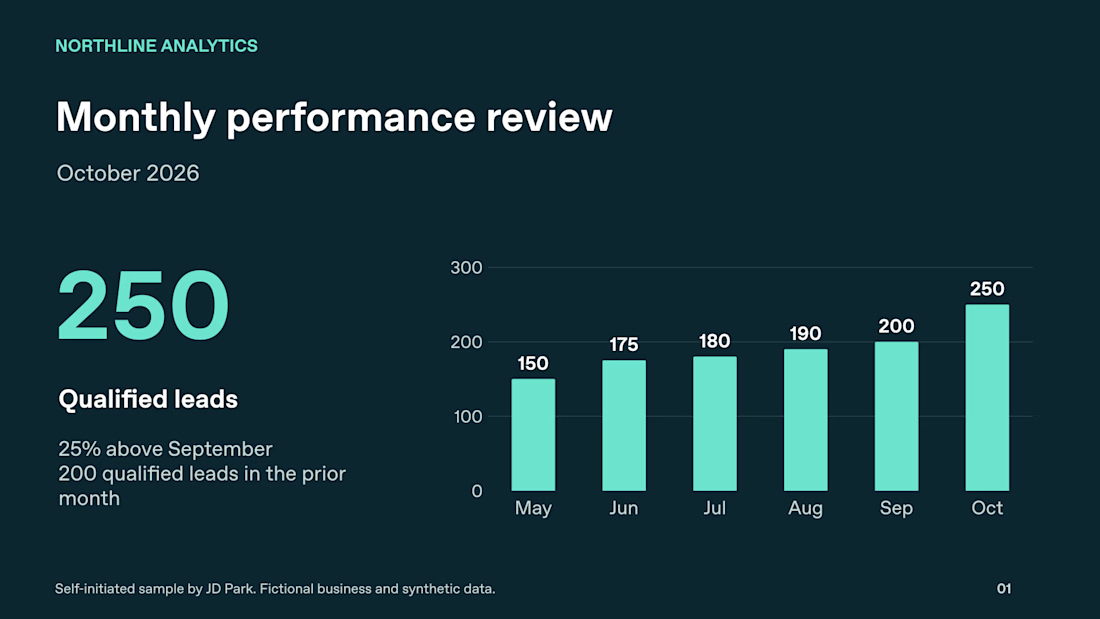
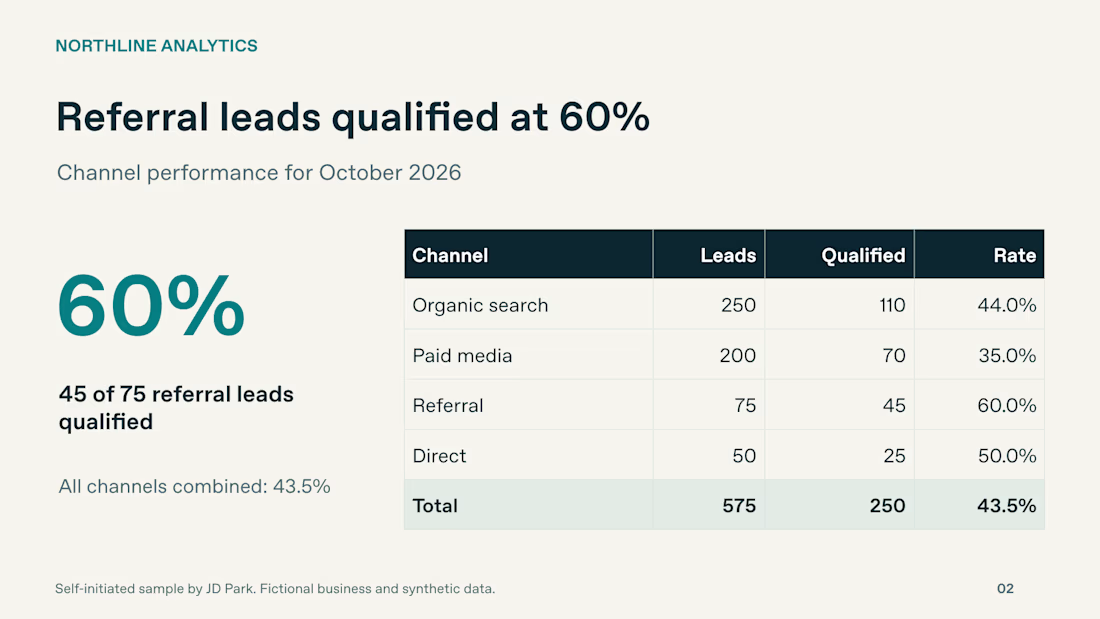
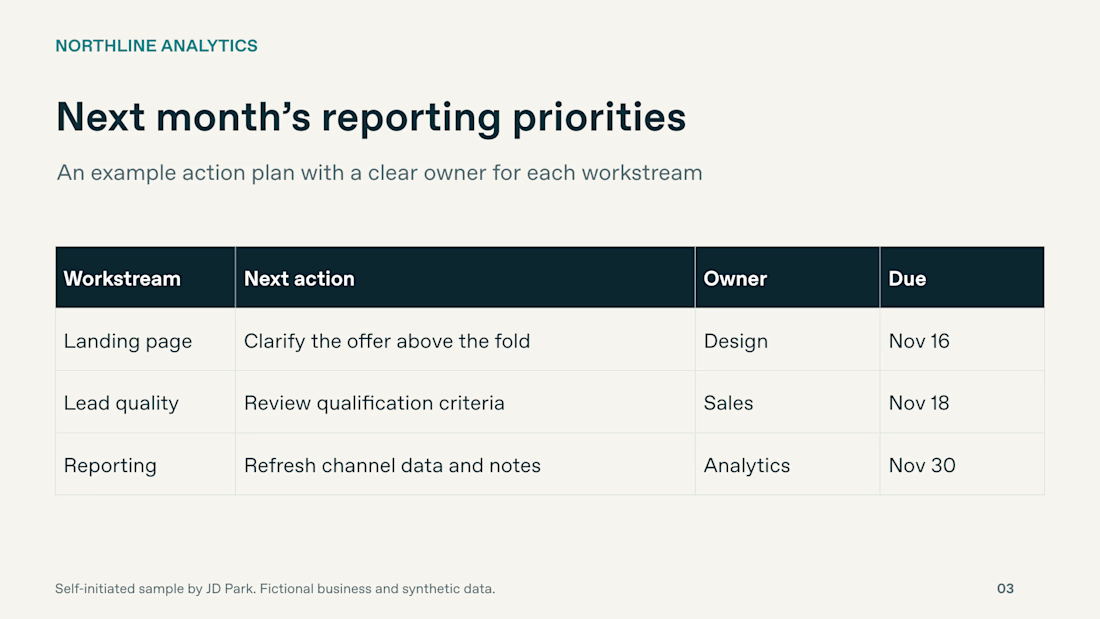
Monthly reporting decks need a clear update path. For this Northline Analytics sample, I built three slides around a reporting sequence: how performance changed, where qualified leads came from, and what the team will do next.
The source PPTX includes editable text, a native chart with an embedded data workbook, and native tables. These images are exports from that file.
One detail worth preserving in recurring reports: every percentage should keep its denominator. Here, 60% means 45 qualified leads out of 75 referral leads.
Self-initiated, AI-assisted presentation design. Fictional business and synthetic data.
When you update a monthly deck, what creates the most rework: charts, tables or layout consistency?

The network for creativity
Join 1.25M professional creatives like you
Connect with clients, get discovered, and run your business 100% commission-free
Creatives on Contra have earned over $150M and we are just getting started



Related posts

AI Analytics Dashboard
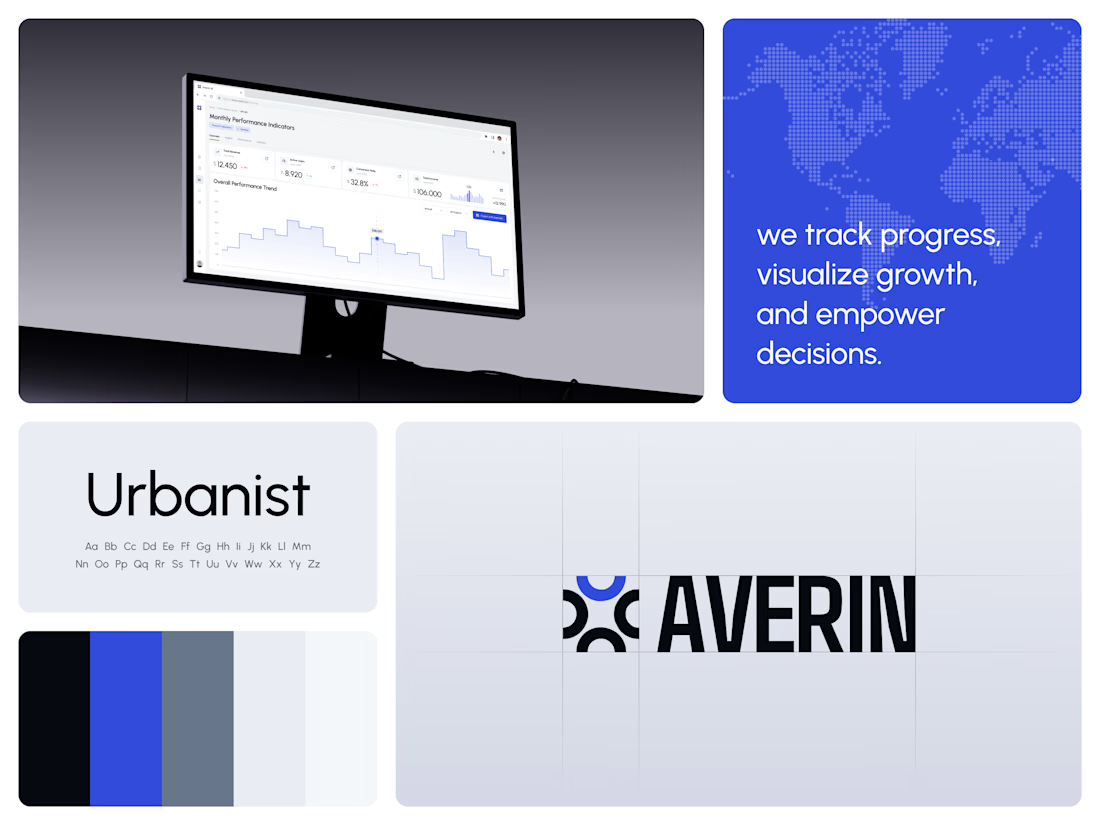
One blue runs from the logo to the chart line.
Revenue, active users, conversion rate and income sit in a row of cards above the trend chart. The cards answer where the numbers stand. The stepped line answers how they got there, holding each period's value until the next, with a tooltip on a dashed guide line for the exact figure.
The identity pairs a four-arc mark with a condensed wordmark, drawn to the same top and bottom lines on the construction grid. The top arc's blue comes back in the slogan tile, the chart line and the main button, so the brand and the product share one accent.
Designed by the Hue & Machine team.
#DashboardDesign #DataVisualization #SaaS #Analytics #AI #WebApp #BrandIdentity #UIDesign #ProductDesign #FigmaDesign




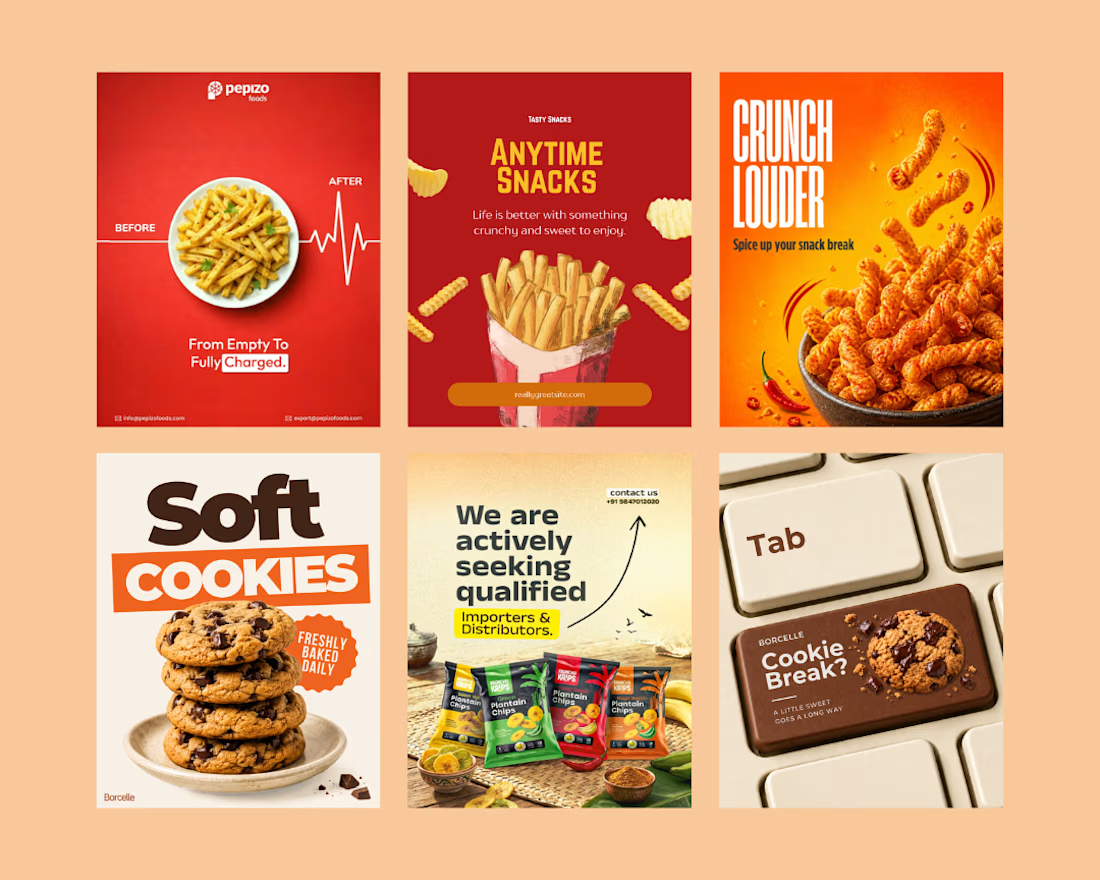
Created eye-catching social media creatives for a snack brand, focusing on mouth-watering visuals, bold typography, and engaging layouts.
The designs highlight product appeal, grab audience attention, and help the brand promote its snacks, offers, and new launches effectively across social media.
Social Content DesignphotoshopposterdesignSocial Media MarketingTypographyAdobe PhotoshopCanvaChatGPT


great job🙌