The network for creativity
Join 1.25M professional creatives like you
Connect with clients, get discovered, and run your business 100% commission-free
Creatives on Contra have earned over $150M and we are just getting started
Back to feedPost

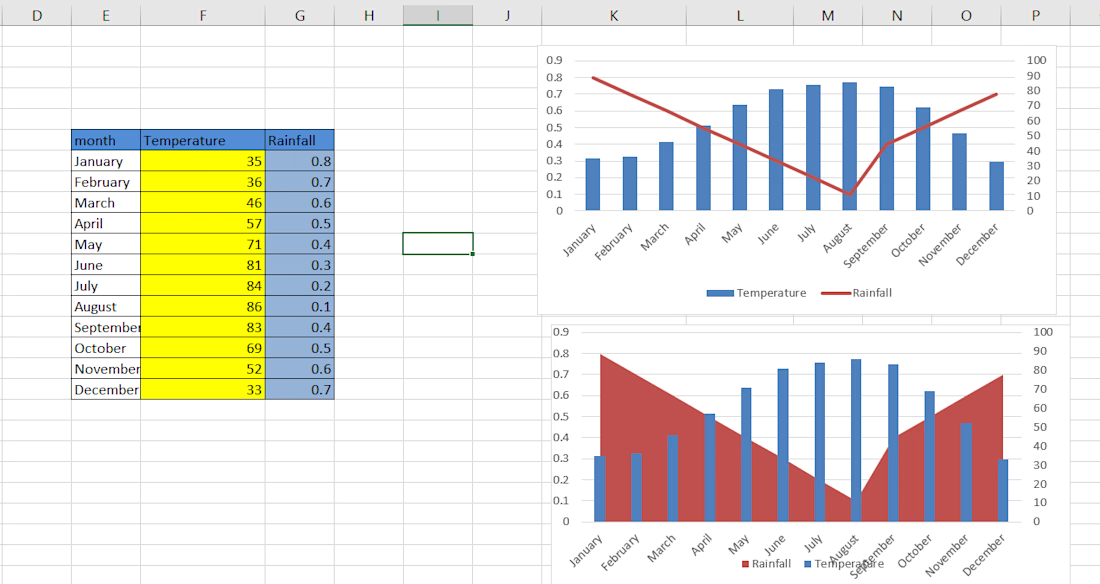
🌦️ Rainfall vs. Temperature: What Do the Charts Reveal?
Here's one of my recent Excel Data Visualization projects, where I explored the relationship between Monthly Temperature and Rainfall through interactive-style chart visualizations.
📊 What I worked on:
Organized and structured monthly temperature and rainfall data.
Created a Combination Chart using Column and Line Charts.
Designed an Area and Column Chart for visual comparison.
Used a secondary axis to represent two different measurement scales.
Presented seasonal patterns in a simple and visually understandable format.
Key Learning: Data becomes more meaningful when it's presented visually. The right visualization makes trends, patterns, and comparisons easier to understand.
🛠️ Tool Used: Microsoft Excel
📈 Skills: Data Visualization | Combo Charts | Secondary Axis | Data Presentation | Excel
This is a small project, but every project is a step towards becoming better at turning data into insights!


The network for creativity
Join 1.25M professional creatives like you
Connect with clients, get discovered, and run your business 100% commission-free
Creatives on Contra have earned over $150M and we are just getting started



Related posts

AI Analytics Dashboard
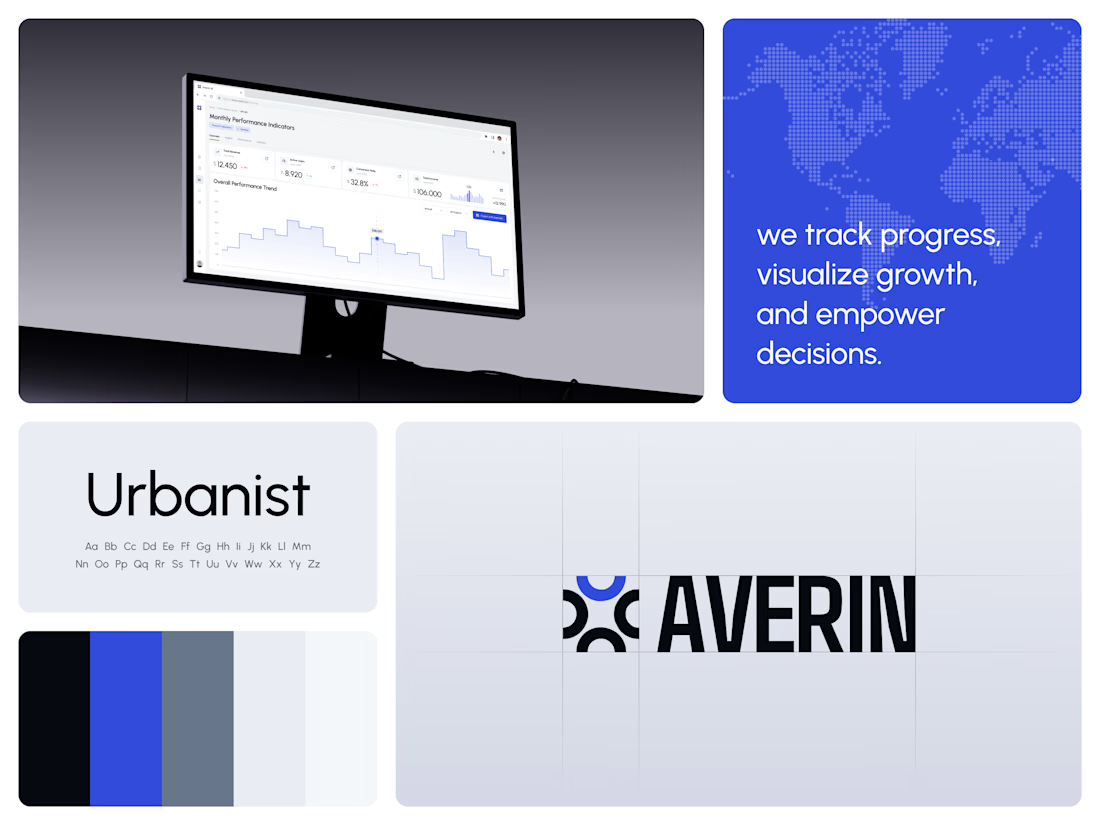
One blue runs from the logo to the chart line.
Revenue, active users, conversion rate and income sit in a row of cards above the trend chart. The cards answer where the numbers stand. The stepped line answers how they got there, holding each period's value until the next, with a tooltip on a dashed guide line for the exact figure.
The identity pairs a four-arc mark with a condensed wordmark, drawn to the same top and bottom lines on the construction grid. The top arc's blue comes back in the slogan tile, the chart line and the main button, so the brand and the product share one accent.
Designed by the Hue & Machine team.
#DashboardDesign #DataVisualization #SaaS #Analytics #AI #WebApp #BrandIdentity #UIDesign #ProductDesign #FigmaDesign



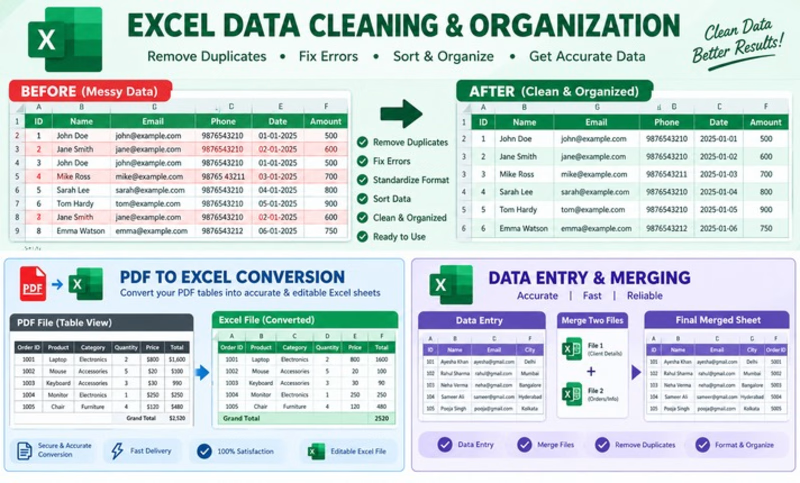
I’m a professional Excel user, helping you with data entry and formatting.


Architectural Visualization, Landscape Design,


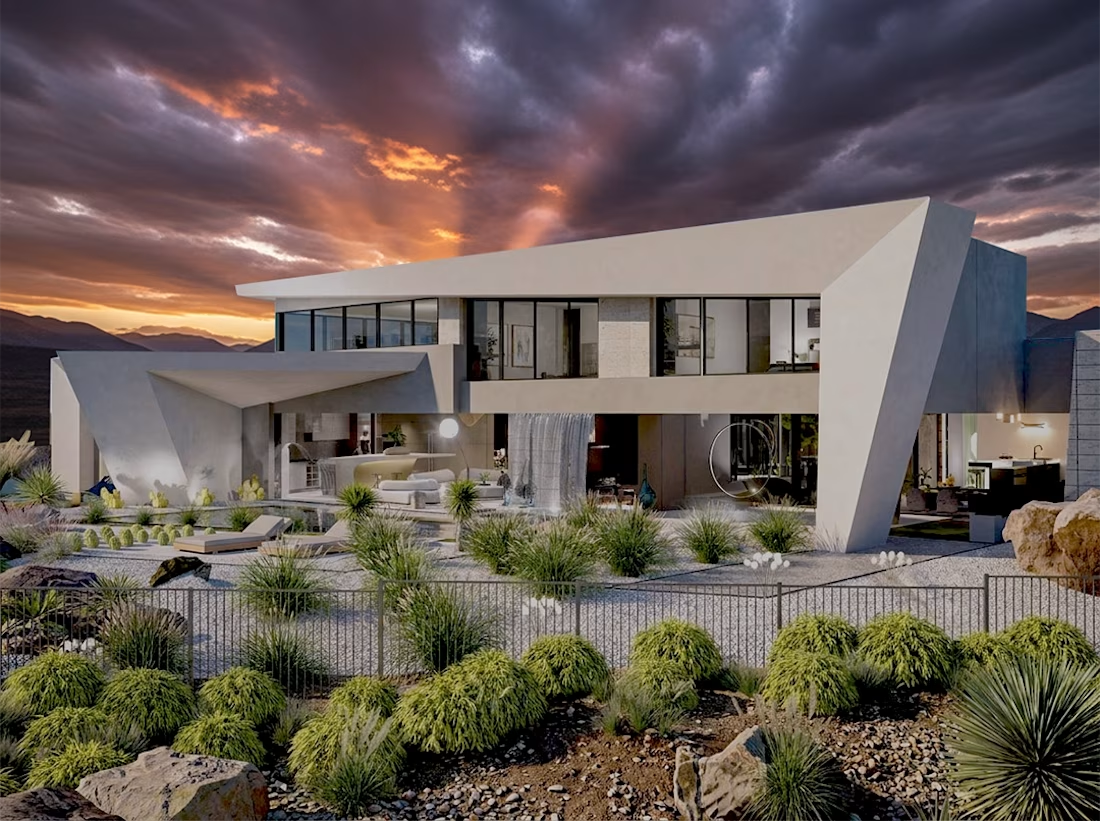

Really liked the edgy form with transparent architecture that feels unique and dynamic...nice visualization also.