The network for creativity
Join 1.25M professional creatives like you
Connect with clients, get discovered, and run your business 100% commission-free
Creatives on Contra have earned over $150M and we are just getting started
Back to feedPost

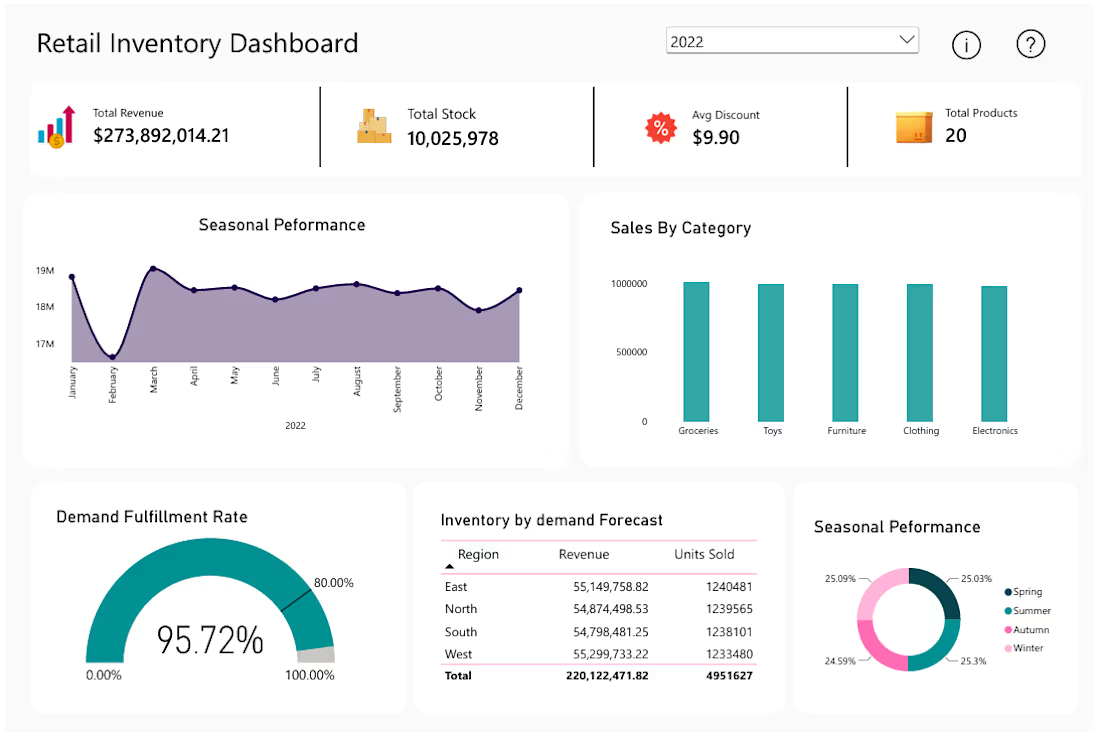
Retail Inventory Sales Analysis
The Business Problem
Private security firms manage vast amounts of operational, workforce, and commercial data scattered across multiple sites, creating severe visibility gaps. Leadership struggles to track real-time incident response times, monitor contract performance, and evaluate workforce deployment efficiency across thousands of active locations. Without a centralized analytics framework, management cannot easily identify high-risk zones, optimize staffing levels, or track high-value revenue streams.
The Solution
Developed an end-to-end, multi-page Power BI executive dashboard suite to centralize enterprise metrics. This solution transforms fragmented security logs, site contracts, and employee records into actionable intelligence, giving leadership complete operational oversight.
Page-by-Page Dashboard Breakdown
1. Overview Page
Purpose: Acts as the executive command center, providing a high-level summary of the entire firm’s health at a single glance.
Key Metrics & Visuals: Displays top-level KPI cards for total contract value ($236M+), active employees, active contracts, total incidents, active sites, and total clients. Features a breakdown of top skills by gender, top 10 clients by contract value, incident trends over time, and a contract status distribution ring.
2. Operations Page
Purpose: Focuses on incident management, emergency response efficiency, and site vulnerability tracking.
Key Metrics & Visuals: Tracks average response time (24.98 mins), active sites (4,398), and total incidents (~396k). Includes a severity breakdown ring (low, medium, high), top 10 incident types (led by warrant arrests and threats), top sites by incident volume, an interactive incidents register table, and a monthly incident trend line.
3. Workforce Page
Purpose: Monitors staff allocation, attendance rates, and shift distributions across all operational zones.
Key Metrics & Visuals: Highlights total workforce assignments (3,000), present employees (2,461), and overall attendance rate (82.03%). Features shift distribution charts (Morning, Evening, Night, Rotating), top 10 assigned sites, employee hiring trends, employment status breakdowns, and a searchable employee directory.
4. Commercial Page
Purpose: Drives business development and financial tracking by analyzing contract types, expiries, and client portfolios.
Key Metrics & Visuals: Summarizes total contract value, active contracts, and total client counts. Breaks down contracts by type (Service Agreement, Security Provision, Consulting, Fixed-Term), highlights top 10 clients, charts contract statuses, and maps out a contract expiry timeline across the year.


The network for creativity
Join 1.25M professional creatives like you
Connect with clients, get discovered, and run your business 100% commission-free
Creatives on Contra have earned over $150M and we are just getting started

Challenges
View all


Related posts

Enterprise RAG AI: Private Doc Intelligence
A fast-growing B2B software firm needed a secure, enterprise-grade Retrieval-Augmented Generation (RAG) system to query thousands of confidential internal documents (legal contracts, technical architecture specs, Notion pages, and employee SOPs) in real time without third-party data leakage.
Key Challenges:
High hallucination risk and irrelevant context retrieval using standard keyword search.
Managing multi-format files (scanned PDFs, tables, markdown) with strict access control based on user hierarchy.
Technical Implementation & Solution:
• Engineered an automated ingestion pipeline in Python with LlamaIndex and LangChain for semantic chunking and metadata preservation.
• Integrated a hybrid vector search architecture pairing dense embeddings (OpenAI text-embedding-3) with sparse BM25 indexing in Qdrant.
• Added a cross-encoder re-ranking layer (Cohere Re-ranker) to prune low-relevance chunks, reducing API token costs by 40%.
• Built robust Role-Based Access Control (RBAC) via FastAPI endpoints, ensuring departmental data isolation.
Results & Impact:
• Dropped internal information retrieval time from 20 minutes to under 4 seconds.
• Attained 98% factual precision with traceable in-line page citations.
• Full on-prem Docker deployment ensuring 100% private data security.



I'd test revoking a user's document access mid-conversation. In your RBAC flow, do cached retrieval results get rechecked against current permissions before they're sent to the reranker or model?

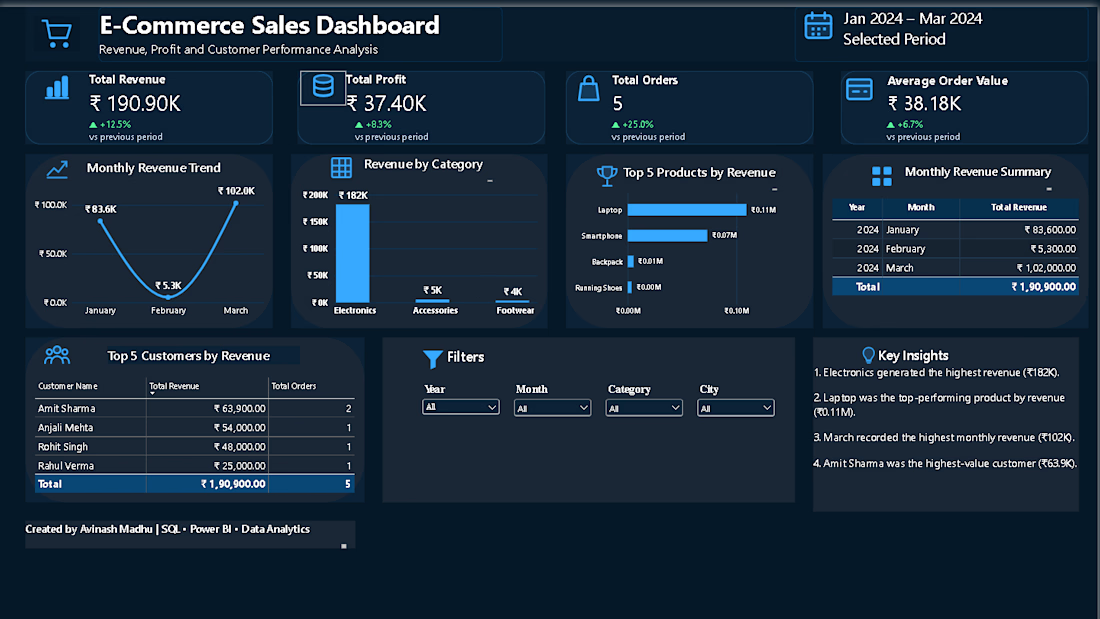
Performed end-to-end e-commerce sales analysis using Python, SQL, and Power BI. Analyzed revenue, profit, product performance, customer orders, and regional trends to uncover insights that can support better business decisions.


E-Commerce Sales Dashboard | Power BI & SQL
Built an interactive e-commerce sales dashboard using SQL and Power BI to analyze revenue, profit, orders, product performance, customer performance, and monthly sales trends.
Key features:
Revenue and profit KPI tracking
Monthly revenue trend analysis
Category and product performance
Top customer analysis
Interactive Year, Month, Category, and City filters
Revenue summary and business insights Tools: SQL, Power BI, Data Analysis, Data Visualization