The network for creativity
Join 1.25M professional creatives like you
Connect with clients, get discovered, and run your business 100% commission-free
Creatives on Contra have earned over $150M and we are just getting started
Back to feedPost
Analysis performed on a telecom company


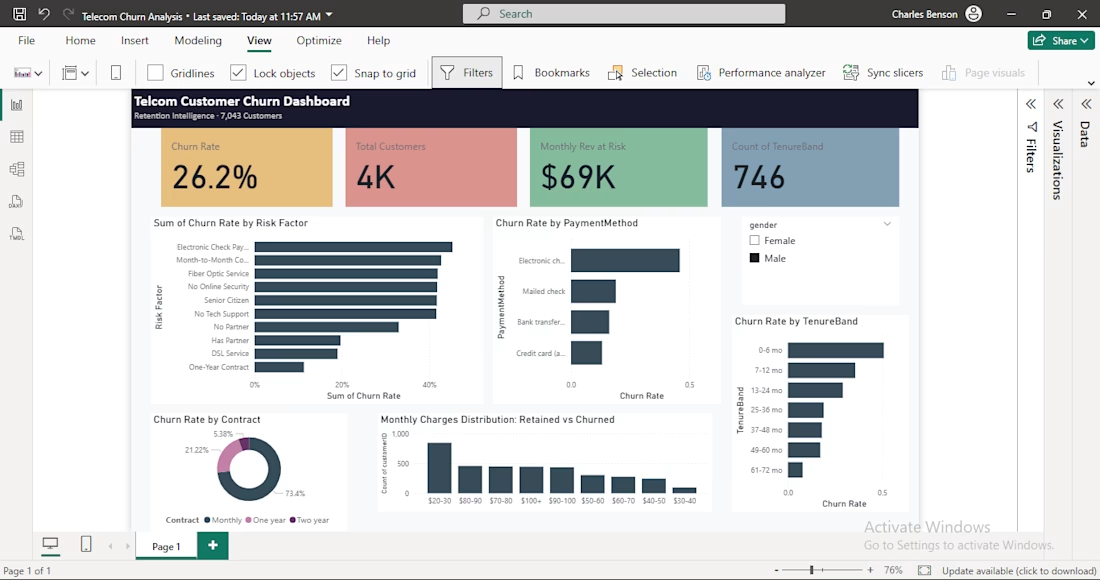

The churn rate by tenure band is the most actionable view here — customers in the 0-6 month band churning at the highest rate points directly to an onboarding problem rather than a product problem, which changes the retention strategy entirely. The contract type breakdown...

Due to the fact that the electronic payment system of the company did not function properly, which led to it being the highest churn rate driver. The payment system of every business should be a top priority to ensure a good customer experience
The network for creativity
Join 1.25M professional creatives like you
Connect with clients, get discovered, and run your business 100% commission-free
Creatives on Contra have earned over $150M and we are just getting started





Related posts

Hi, I’m an experienced Bookkeeper dedicated to keeping your business finances accurate, organized, and up to date.
If you hire me, I’ll take care of your day-to-day bookkeeping so you can focus on running and growing your business.
What I’ll do for you:
Categorize and record transactions accurately
Reconcile bank and credit card accounts
Manage Accounts Payable & Receivable
Record invoices, bills, payments, and deposits
Clean up and organize your books
Handle month-end closing
Prepare accurate financial reports
Maintain QuickBooks Online, QuickBooks Desktop, or Xero
My goal is simple: clean books, accurate numbers, and a clear picture of your business finances.🙌


Wishing you the best of luck 😊

Project Title:
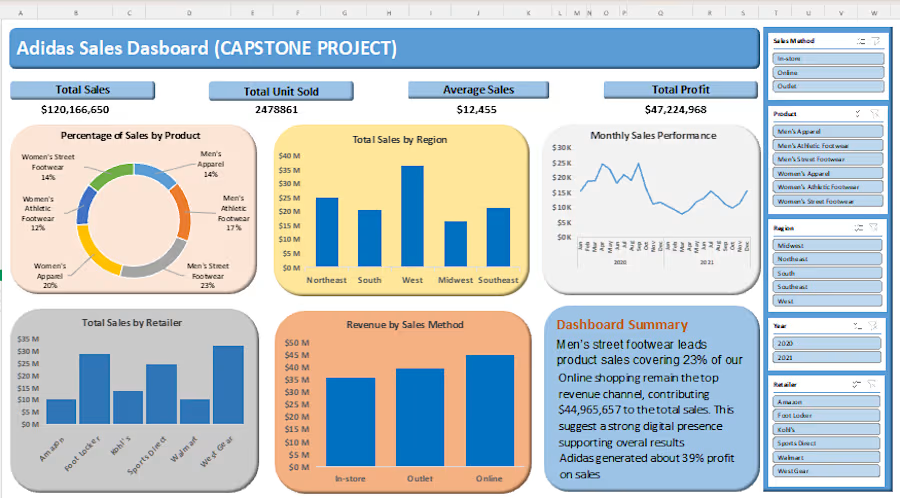
Adidas Sales Performance & Profitability Analysis (Capstone Project)
Overview:
A comprehensive interactive Excel analytics dashboard developed as a Capstone Project to analyze Adidas' overall sales revenue, unit distribution, regional performance, and profit margins. This dashboard transforms raw retail data into executive-ready visuals that highlight top-performing channels, regional growth opportunities, and product category trends.


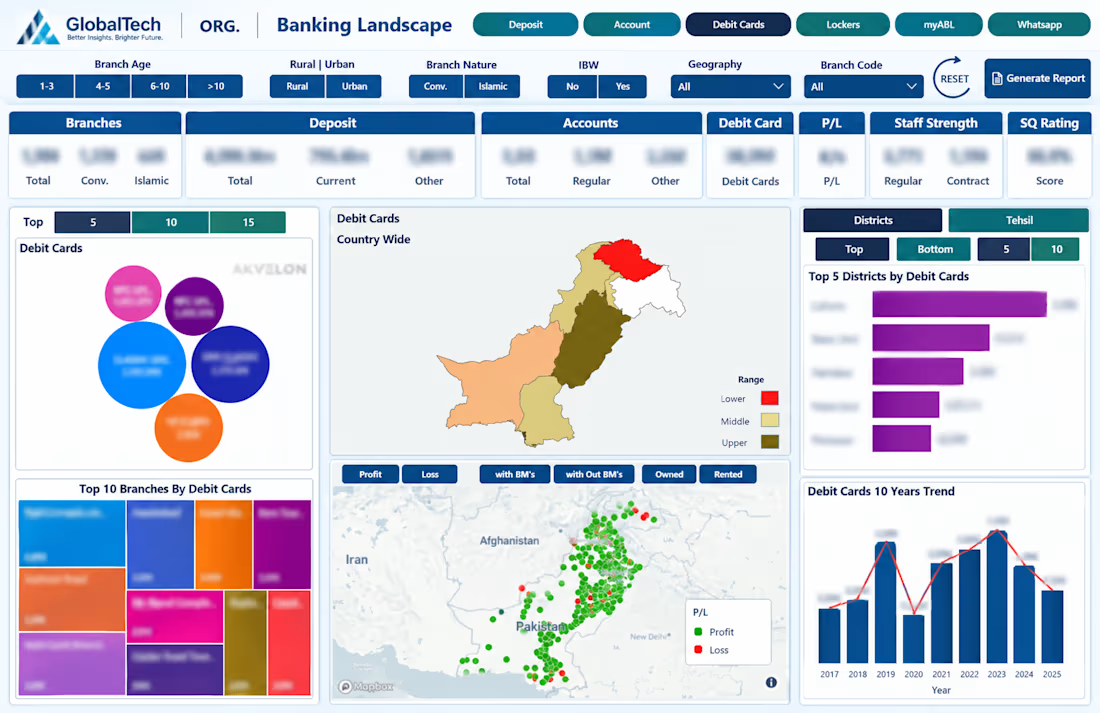
I have develope this dashboard for a leading Banks in pakistan.