The network for creativity
Join 1.25M professional creatives like you
Connect with clients, get discovered, and run your business 100% commission-free
Creatives on Contra have earned over $150M and we are just getting started
Back to feedPost

Document parsing and validation for Immigration clients


The network for creativity
Join 1.25M professional creatives like you
Connect with clients, get discovered, and run your business 100% commission-free
Creatives on Contra have earned over $150M and we are just getting started
Related posts

I wanted to see how far I could take an idea using AI, so I built something.
Meet Instant CSV Dashboard 🚀
It's an experiment in making data easier to explore by turning CSV files into interactive dashboards.
I built it using AI tools, moving beyond static designs to create something people can actually try.
I'm sharing a short demo of the experience, and I'd love to hear what you think.
Have a look: https://interactive-csv-dashboards.ai.studio/
If you work with data regularly, what would you want a tool like this to do for you?
#ProductDesign #AI #DataVisualization
@Google USA


Nice one. I'd want it to pick the right chart for each column on its own. That's where most people get stuck.

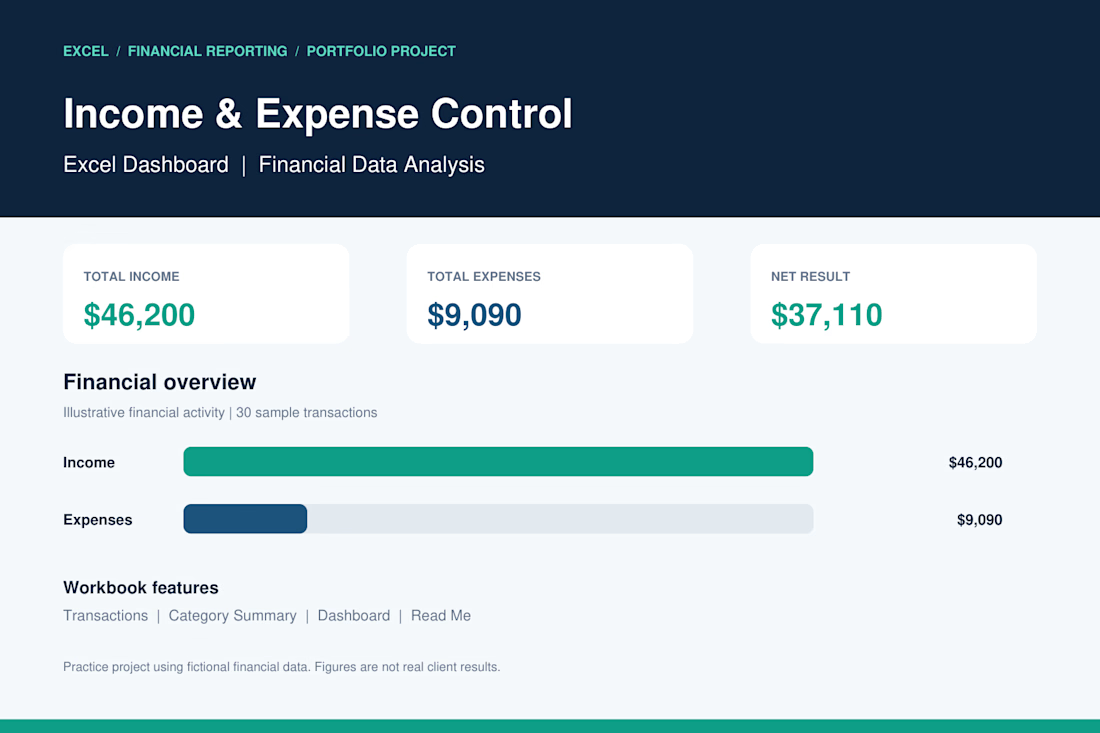
Income & Expense Control | Excel Dashboard
I developed a professional Excel dashboard as a portfolio practice project to demonstrate my skills in financial data management, income and expense tracking, and business reporting.
Project Features:
Automated income and expense calculations.
Financial dashboard with key performance indicators (KPIs).
Transaction tracking and organization.
Expense analysis by category.
Financial charts and visual reporting.
Net income calculation.
Project Results (Sample Data):
Total Income: $46,200
Total Expenses: $9,090
Net Result: $37,110
Tools: Microsoft Excel
Skills: Data Analysis, Accounting, Financial Reporting, Data Entry.
This project demonstrates my ability to organize financial records, analyze business performance, and create clear financial reports using Microsoft Excel.
Note: This is a portfolio demonstration using fictional financial data.


Great work 👏🏻

Having trouble deciding on the final material palette? Take a look at our latest case study showing how we helped test different kitchen finishes in 3D - from swapping range hoods to testing bold versus neutral backsplashes. Check out the full project on my profile to see how visualization speeds up design approvals!