The network for creativity
Join 1.25M professional creatives like you
Connect with clients, get discovered, and run your business 100% commission-free
Creatives on Contra have earned over $150M and we are just getting started
Back to feedPost

Zepto Operations & Delivery Analytics Dashboard
In the quick-commerce industry, delivery speed and SLA compliance drive customer satisfaction. To give operations teams clear visibility into delivery bottlenecks, category margins, and dark store performance, I built this end-to-end operational dashboard in Power BI.
Check out the short video demo to see the interactive visuals in action.
Key Features Demonstrated:
Executive KPI Suite: Real-time visibility into Total Revenue, Total Profit, Average Delivery Time, and High-Risk Order Flags.
Dark Store & Category Performance: Evaluating profit drivers (Meat & Seafood vs. Fresh Produce) paired with dark store comparison tables formatted with embedded teal data bars.
AI-Powered Root Cause Diagnostics: Interactive Decomposition Tree with dynamic color gradients to drill down into delivery delays (Late <5m, Severely Delayed) across product categories, dark store IDs (DS_BLR_01, DS_MUM_02), and delivery distances.
Tech Stack & Analytical Skills:
Tool: Power BI Desktop
Data & Modeling: DAX (Custom Measures & KPI Logic), Power Query, Data Modeling
Design & UX: Interactive Root Cause Analysis, Custom Palette (Zepto Brand Theme), Conditional Formatting Gradients
Business Impact: Helps regional operations managers proactively reallocate delivery fleets and optimize dark store packing workflows during peak demand hours.


The network for creativity
Join 1.25M professional creatives like you
Connect with clients, get discovered, and run your business 100% commission-free
Creatives on Contra have earned over $150M and we are just getting started
Related posts

This interactive dashboard provides a comprehensive view of profit performance across multiple dimensions—time, segments, regions, categories, and sub‑categories.
This dashboard transforms raw business data into actionable insights by allowing stakeholders to quickly identify profitable areas, spot regional trends, and evaluate category performance. It’s designed for clarity, interactivity, and decision‑making support.
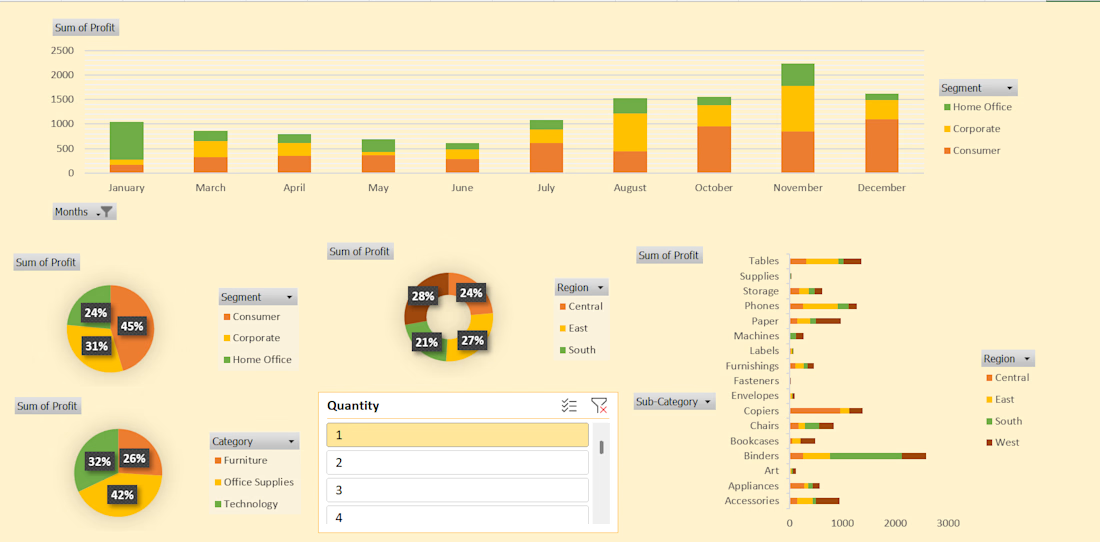
#This is an excellent Profit Dashboard which is made in MS Excel with multiple creative functions help in understanding Monthly , Yearly , Area wise Profits.

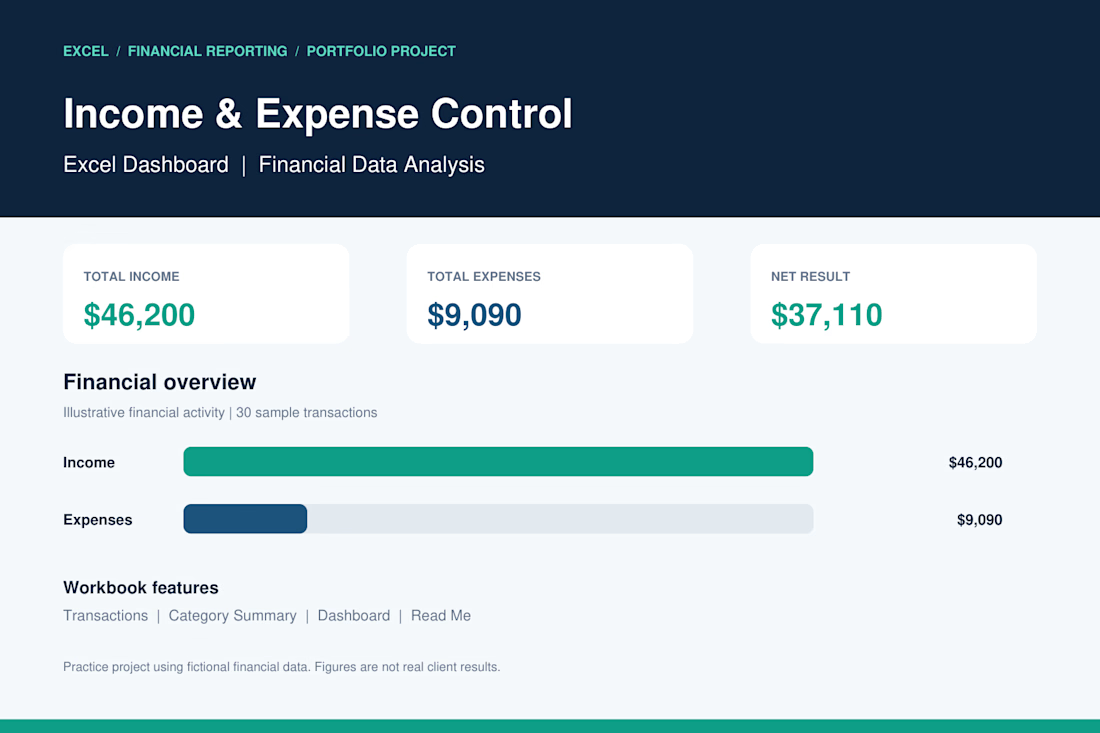
Income & Expense Control | Excel Dashboard
I developed a professional Excel dashboard as a portfolio practice project to demonstrate my skills in financial data management, income and expense tracking, and business reporting.
Project Features:
Automated income and expense calculations.
Financial dashboard with key performance indicators (KPIs).
Transaction tracking and organization.
Expense analysis by category.
Financial charts and visual reporting.
Net income calculation.
Project Results (Sample Data):
Total Income: $46,200
Total Expenses: $9,090
Net Result: $37,110
Tools: Microsoft Excel
Skills: Data Analysis, Accounting, Financial Reporting, Data Entry.
This project demonstrates my ability to organize financial records, analyze business performance, and create clear financial reports using Microsoft Excel.
Note: This is a portfolio demonstration using fictional financial data.

Great work 👏🏻

Business data often lives across payment, analytics, CRM, advertising, and inventory platforms. Metrik brings those signals together in one dashboard built for startups and small businesses.
See revenue, orders, customers, and business health at a glance. Compare advertising spend and ROAS across channels, explore visual KPI cards, and use smart alerts to spot unusual changes and potential risks.
The interface pairs a clean layout and rounded components with soft gradients, colorful analytics, and clear visual hierarchy, helping make business performance easier to follow.
