The network for creativity
Join 1.25M professional creatives like you
Connect with clients, get discovered, and run your business 100% commission-free
Creatives on Contra have earned over $150M and we are just getting started
Back to feedPost
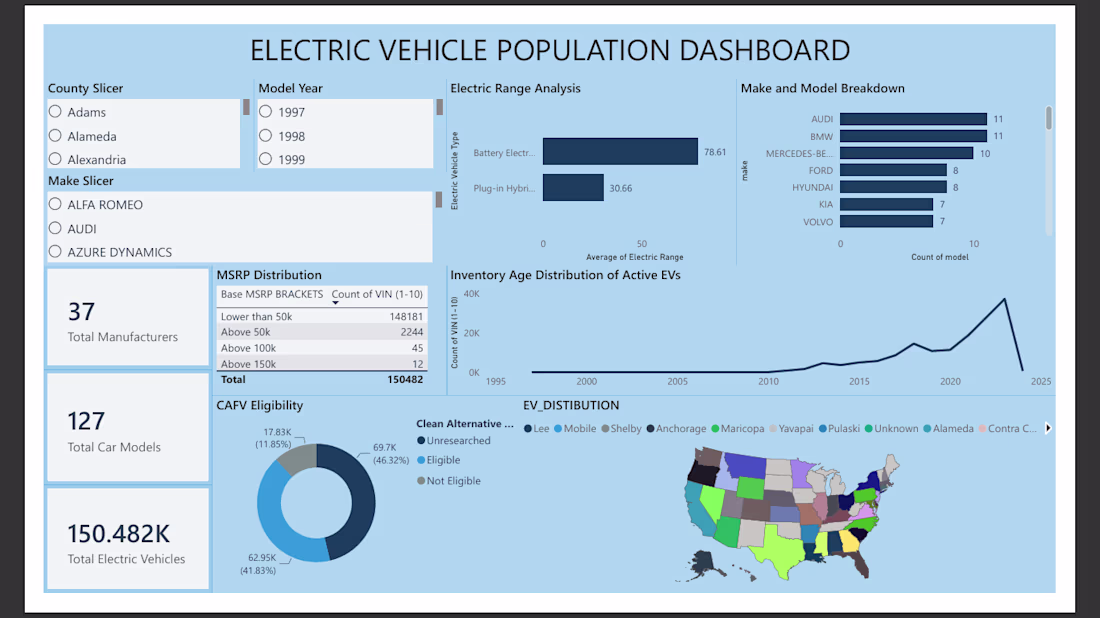
Electric Vehicle (EV) Population Dashboard
I designed and developed this interactive Power BI dashboard to analyze the growth, distribution, and market composition of over 150,000 electric vehicles.
Key Features & Insights Visualized:
Executive Metrics: Tracks 150.4K+ total electric vehicles across 37 manufacturers and 127 unique car models.
Interactive Filtering: Built dynamic slicers filtering data seamlessly by County, Model Year, and Vehicle Make.
Market Breakdown: Features an analysis of battery type distributions (BEV vs. PHEV), MSRP price brackets, and Clean Alternative Fuel Vehicle (CAFV) eligibility.
Trend & Geographic Analysis: Includes an inventory age growth curve tracking active EV adoption over time, paired with a geographic distribution map.
Power BI |Data Analytics |Data Visualization |Data Modeling
The network for creativity
Join 1.25M professional creatives like you
Connect with clients, get discovered, and run your business 100% commission-free
Creatives on Contra have earned over $150M and we are just getting started
Related posts

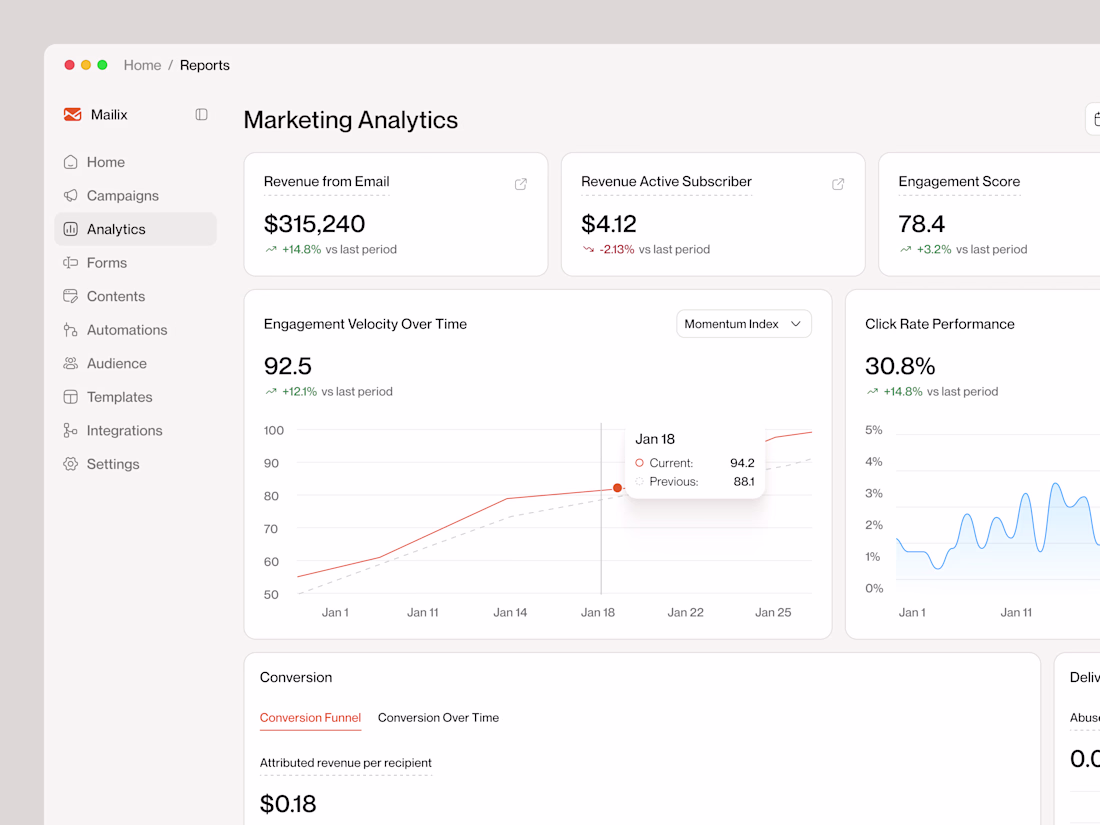
New exploration: Email Marketing Analytics Dashboard
Wanted to rethink how email marketers interact with their campaign data. Most tools feel like spreadsheets with extra steps, so I explored a cleaner approach: scannable metrics, inline campaign comparisons, and a visual system that gives data-dense views room to breathe.
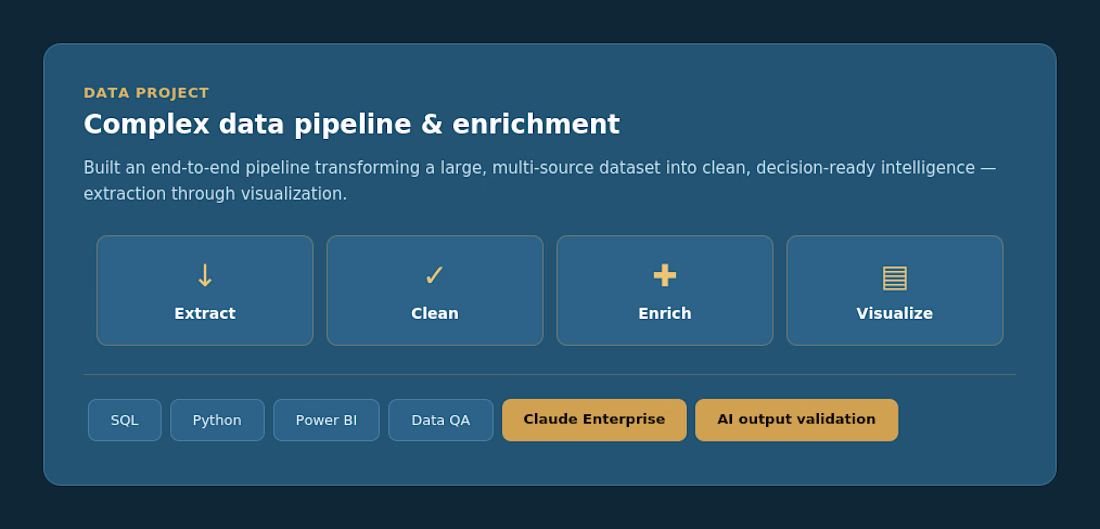
clean
Designed and built a full data pipeline — pulling from multiple sources, resolving inconsistencies, enriching with external variables, and delivering clean outputs through interactive Power BI dashboards stakeholders can actually act on.
Designed and built a full data pipeline — pulling from multiple sources, resolving inconsistencies, enriching with external variables, and delivering clean outputs through interactive Power BI dashboards stakeholders can actually act on.
The starting point was a large, structurally complex dataset with inconsistent formats, missing values, and misaligned fields. The goal was a repeatable pipeline that transformed it into something reliable enough to drive real decisions.
The enrichment layer was the differentiator: layering in demographic and contextual variables from external sources to add depth that the raw data alone couldn't provide. The final output was a Power BI dashboard built for non-technical audiences — clear enough to act on, rigorous enough to hold up to scrutiny.
AI-assisted validation (Claude Enterprise) was used throughout to cross-check outputs and flag inconsistencies before delivery
Trending
Claude
Claude has entered the design space. How are you using Claude Design?
Contra University
Learn from expert creatives how to earn more using next-gen AI tools.
MagicPath
The canvas is infinite, and exploration is becoming the workflow. How are you using MagicPath?
creativeaiflow
Creative AI workflows are evolving. What tools do you use, and what are their strengths and weaknesses?
freelancerlife
Freelancer life is wins, pivots, and everything in between. What’s yours right now?