The network for creativity
Join 1.25M professional creatives like you
Connect with clients, get discovered, and run your business 100% commission-free
Creatives on Contra have earned over $150M and we are just getting started
Back to feedPost
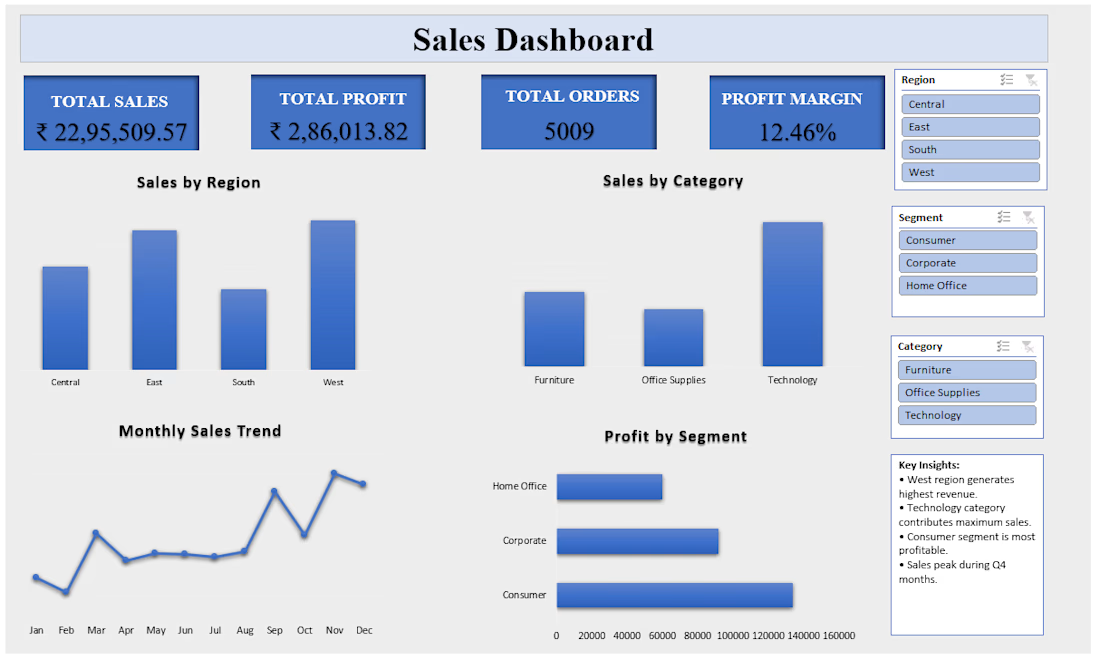
This project presents an interactive Sales Performance Dashboard built using Microsoft Excel. The dashboard analyzes key business metrics such as total sales, profit, profit margin, customer segments, and monthly sales trends.
The objective of this project is to transform raw transactional data into meaningful business insights using Excel’s analytical tools, enabling better understanding of sales performance across regions, categories, and customer segments.
The network for creativity
Join 1.25M professional creatives like you
Connect with clients, get discovered, and run your business 100% commission-free
Creatives on Contra have earned over $150M and we are just getting started
Related posts
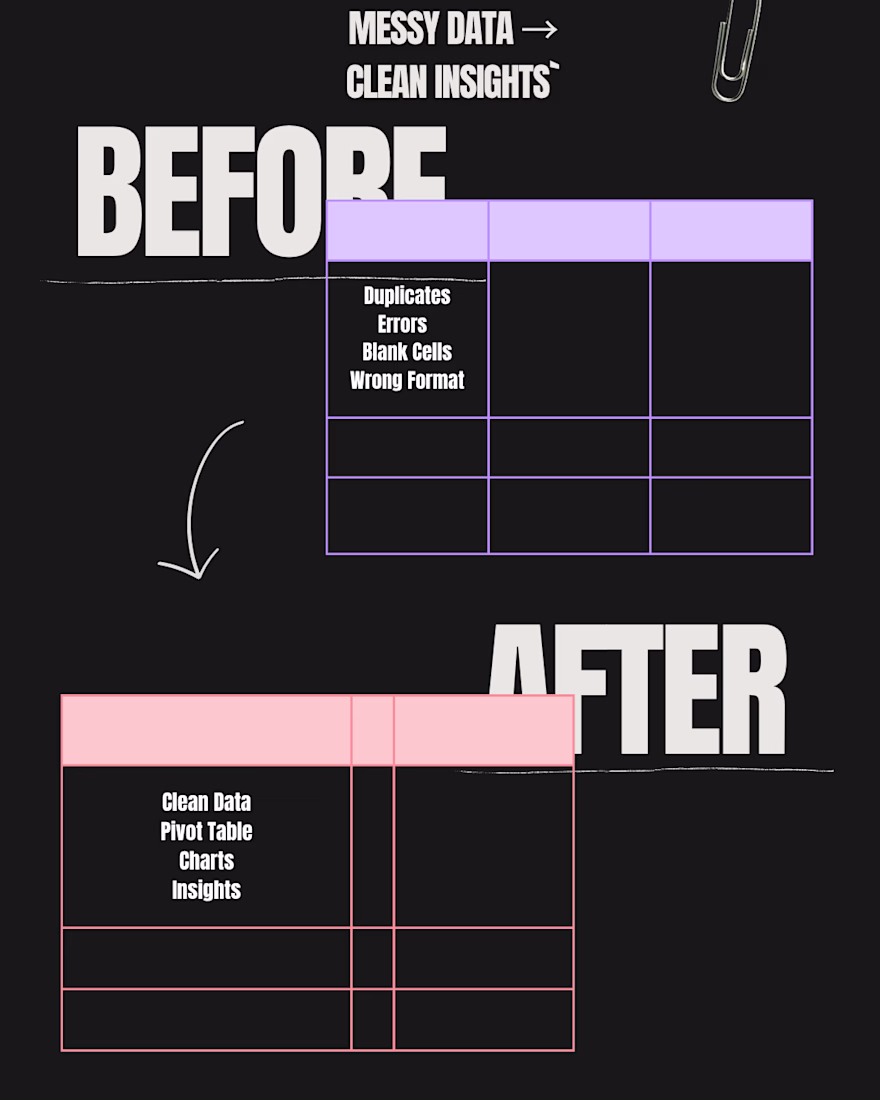
Transformed messy Excel with duplicates & errors into clean dashboard with Pivot Table & Insights.BEFORE: Duplicate data, blank cells, wrong format AFTER: Clean data, charts, 5-min reports Need clean data fast? DM me "CLEAN" ⚡:🔥
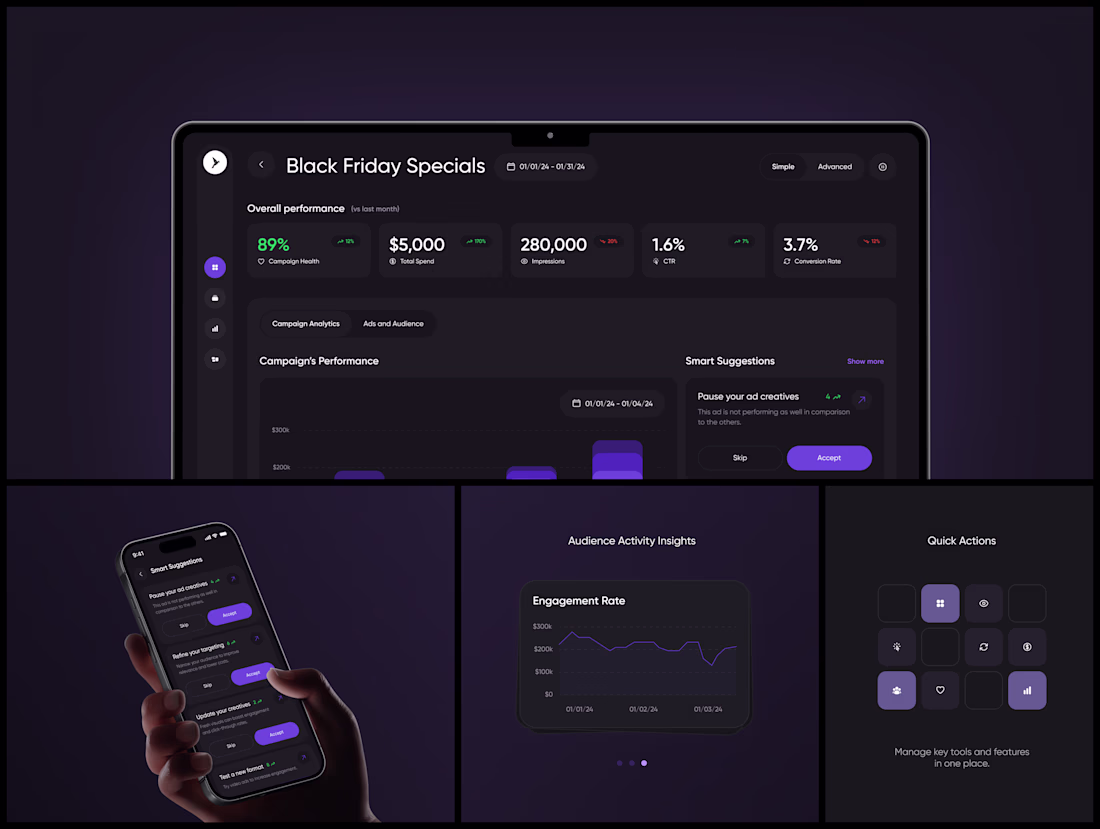
ADGOJI: Ad Campaign Analytics Dashboard (SaaS + Mobile)
Black Friday at 89% campaign health. Now show me that without a spreadsheet.
That's the test. A marketing manager running Black Friday specials doesn't have time to interpret data. They need to glance at a screen and know: is this working or not?
The "Smart Suggestions" panel on the right was the hardest design call. "Pause your ad creatives" with a Skip/Accept binary. That's the AI making a recommendation and the UI making it frictionless to act on. Most analytics dashboards show you data. This one shows you data and then asks: "so what are you going to do about it?" That shift from passive reporting to active decision-making changed the whole product positioning.
The mobile version doesn't compress the dashboard, it rethinks it. Swipeable suggestion cards instead of a sidebar. Because nobody's managing ad campaigns on their phone unless something's on fire, and when something's on fire, they need actions.
#UIDesign #SaaS #Dashboard #DataVisualization #MobileDesign #ProductDesign #AdTech #DarkUI #Analytics #FigmaDesign
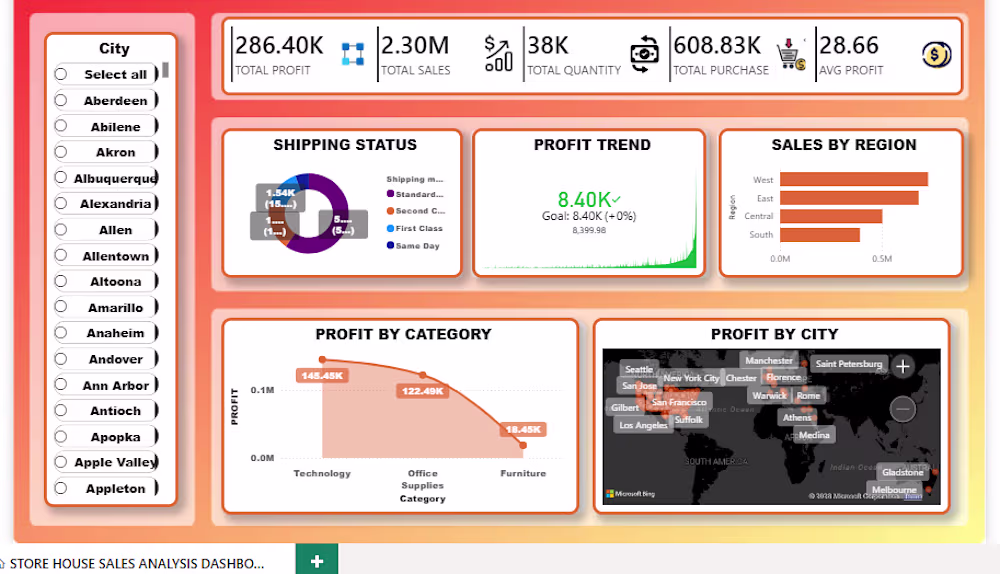
STORE HOUSE SALES DATA ANALYSIS DASHBOARD
TOOLS USED - (Python,Pandas,Numpy,Power bi)
If you want this type of dashboard for your business then checkout my service page on "Contra"
Trending
Claude
Claude has entered the design space. How are you using Claude Design?
Contra University
Learn from expert creatives how to earn more using next-gen AI tools.
fifaworldcup2026
The World Cup is here and the whole world's watching. How are you designing for the world stage?
creativeaiflow
Creative AI workflows are evolving. What tools do you use, and what are their strengths and weaknesses?
freelancerlife
Freelancer life is wins, pivots, and everything in between. What’s yours right now?