The network for creativity
Join 1.25M professional creatives like you
Connect with clients, get discovered, and run your business 100% commission-free
Creatives on Contra have earned over $150M and we are just getting started
Back to feedPost

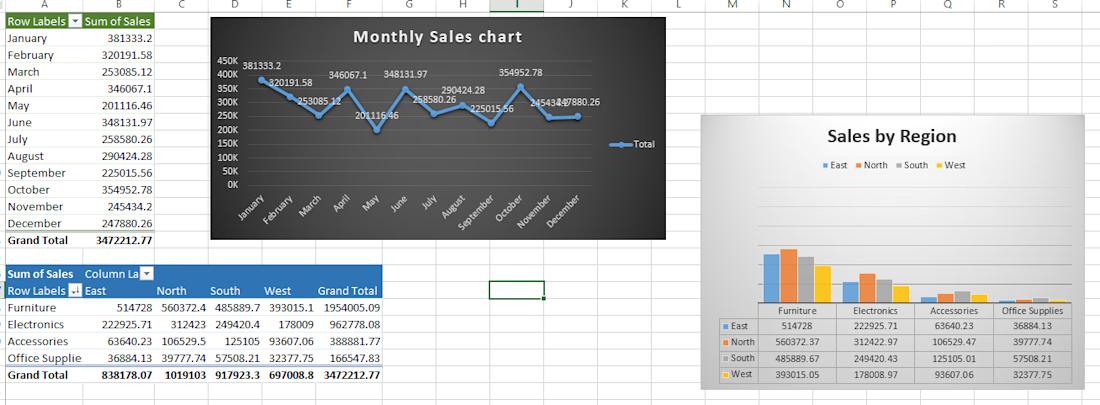
This project focuses on analyzing sample sales data using Microsoft Excel to identify business trends, compare regional performance, and evaluate product category profitability.
I organized and analyzed the dataset using Excel formulas, PivotTables, and charts to transform raw sales records into meaningful business insights.
Key Activities
Analyzed monthly sales trends to understand changes in sales performance throughout the year.
Compared sales and profit across North, South, East, and West regions.
Evaluated sales, profit, and profit margins across product categories.
Used Excel formulas and PivotTables to summarize key performance indicators.
Created charts and visual summaries to make findings easier to understand.
Tools Used: Microsoft Excel
Project Outcome: Produced a structured sales analysis highlighting monthly trends, regional differences, and category-level profitability to support data-informed decision-making.
This portfolio project uses sample data and demonstrates my practical skills in Excel analysis, business reporting, and data visualization.

The network for creativity
Join 1.25M professional creatives like you
Connect with clients, get discovered, and run your business 100% commission-free
Creatives on Contra have earned over $150M and we are just getting started











Related posts

How I Built an End-to-End Sales Analytics Dashboard in Excel for an E-commerce Company
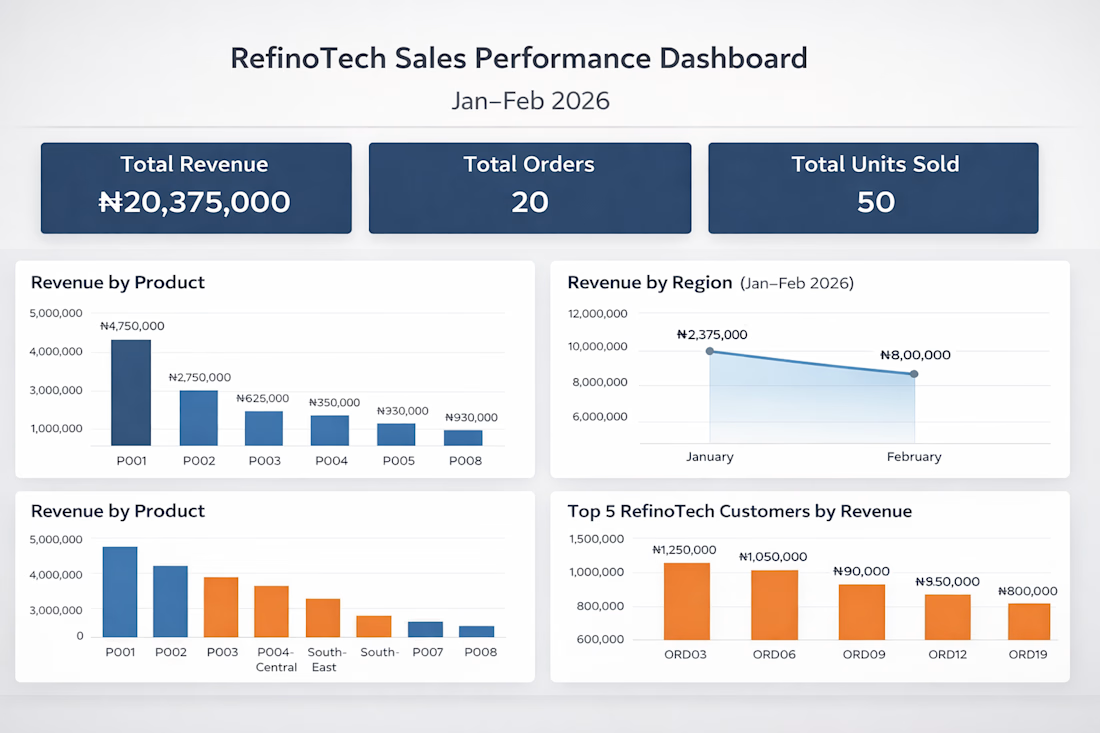
I recently completed an end-to-end sales analytics project using Microsoft Excel, transforming raw e-commerce sales data into an interactive dashboard that provides meaningful business insights.
In this project, I explored the data, performed analysis, identified key sales trends, and built an interactive dashboard to help businesses make data-driven decisions.
I documented the entire process, including the approach, tools, analysis, and dashboard development.
Read the full project walkthrough on Medium: https://medium.com/@Refino/how-i-built-an-end-to-end-sales-analytics-dashboard-in-excel-for-an-e-commerce-company-e8692d81f354



Excellent work! Turning raw data into actionable business insights is a valuable skill.

PROJECT
Analyzed a telecom customer churn dataset of 7,043 customers and built five Excel deliverables: a churn count chart, a monthly charges histogram, a gender-based churn comparison, a tenure vs monthly charges heatmap, and sorted and filtered dataset views.
PROBLEMS SOLVED
• Identified that saving the raw file as .csv was causing data loss, then moved all work to an .xlsx workbook to protect multi-sheet analysis
• Investigated blank Total Charges values and traced them to new customers with 0 months of tenure who had not yet been billed
• Turned hundreds of unique tenure and charge values into readable bands (12-month tenure groups, 20-unit charge groups) so a heatmap could be built
• Used pivot tables to compare churn counts across categories instead of counting manually
RESULTS
• Overall churn: 1,869 of 7,043 customers (about 26.5%)
• Gender: churn was nearly equal, 26.9% for female and 26.2% for male customers
• Tenure: 999 of the 1,869 churned customers (about 53%) left within their first 12 months
• Heatmap: churn was most concentrated among short-tenure customers paying mid-to-high monthly charges
• Delivered formatted charts with titles, axis labels, data labels and distinct colors, plus a video walkthrough
SKILLS: Excel, Pivot Tables, Conditional Formatting, Data Cleaning, Data Visualization, Data Interpretation, Churn Analysis

SaaS Runway & Burn Dashboard for Founders
An interactive dashboard that shows founders how long their cash will last. Change hiring, revenue growth or expenses and see runway, burn and cash-out date update instantly. Built as a demo of the financial dashboards I create for early-stage startups.
financialmodelingfinancialforecastingstartupfinanceData VisualizationFinancial PlanningFinancial AnalysisGoogle SheetsMicrosoft ExcelPython


Letting founders drag a hiring slider and watch the cash-out date move is what makes runway real. A spreadsheet gives them a number; this shows the cost of each decision before they make it.