The network for creativity
Join 1.25M professional creatives like you
Connect with clients, get discovered, and run your business 100% commission-free
Creatives on Contra have earned over $150M and we are just getting started
Back to feedPost

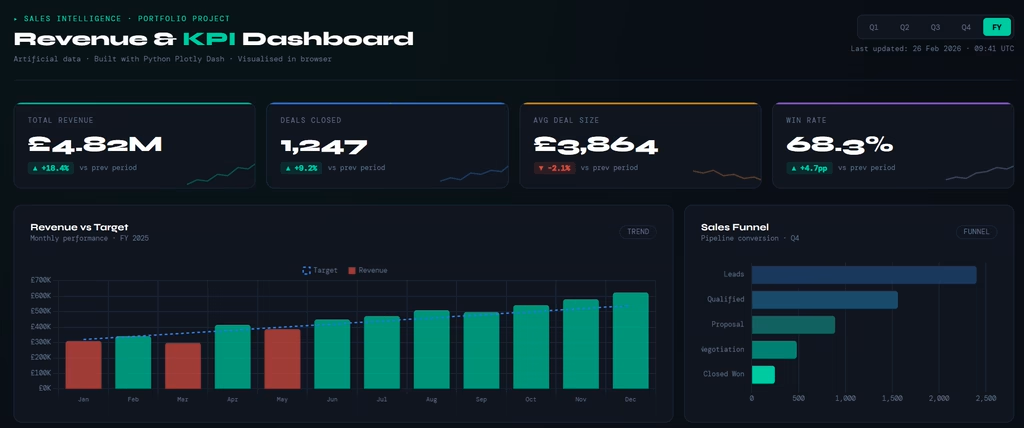
Revenue KPI dashboard from a recently delivered project (published version uses modified artificial data).
This dashboard is built around clarity and storytelling. Every KPI is positioned to guide the user through the revenue narrative—performance, variance, and trend—without overwhelming them. Strong readability, clear hierarchy, and focused visuals ensure stakeholders can quickly understand what’s driving growth and where attention is needed. 😉


The network for creativity
Join 1.25M professional creatives like you
Connect with clients, get discovered, and run your business 100% commission-free
Creatives on Contra have earned over $150M and we are just getting started
Related posts

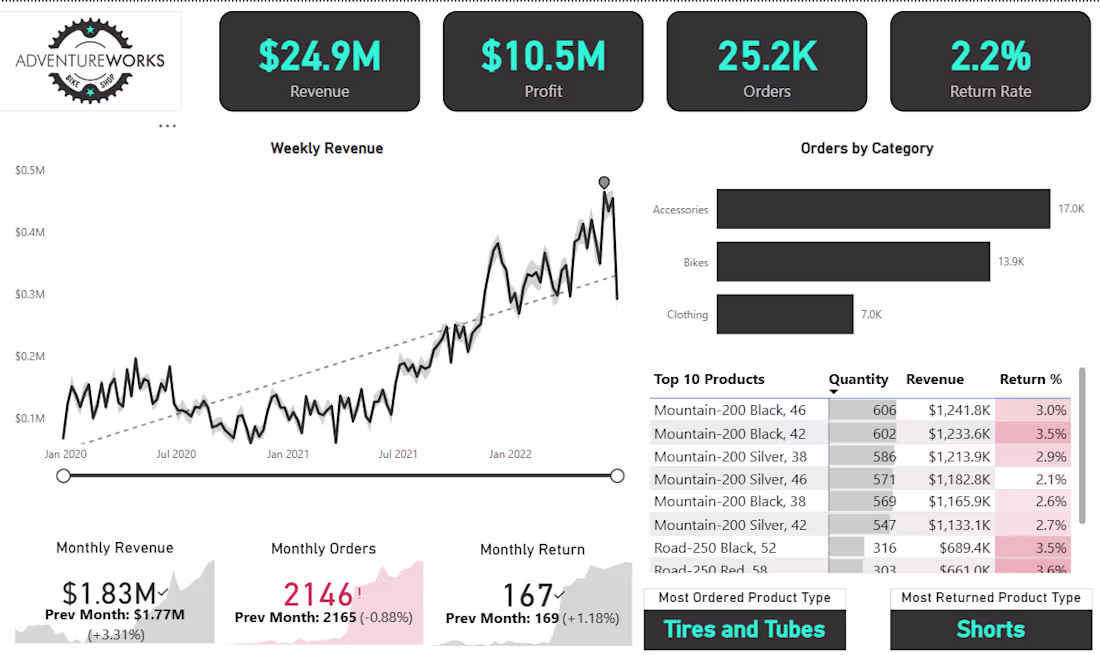
Startups don’t need more data , they need clear decisions.
Most teams collect sales, marketing, and customer data but struggle to answer:
• Why are conversions dropping?
• Which customers drive real revenue?
• Where are we losing money?
I help turn raw data into clear dashboards and actionable insights.
🔎 I can help with:
✔ KPI dashboards (Power BI / Excel)
✔ SQL analysis & reporting
✔ Customer & revenue analysis
✔ Funnel & retention insights
✔ Basic predictive models
I focus on practical insights — not just charts.
📩 Open to short-term and ongoing analytics projects.
— Rabi Ali
Data Analyst | SQL | Python | Power BI


This is the browser-based analyzer in action: responsive waterfall for signal peaks + easy tweaks in the left panel. Ideal starter tool if you don't own an SDR yet. Hands-on learning, no hardware required.. the dashboard has playable audio for livestreams. https://on.contra.com/fQJPJp

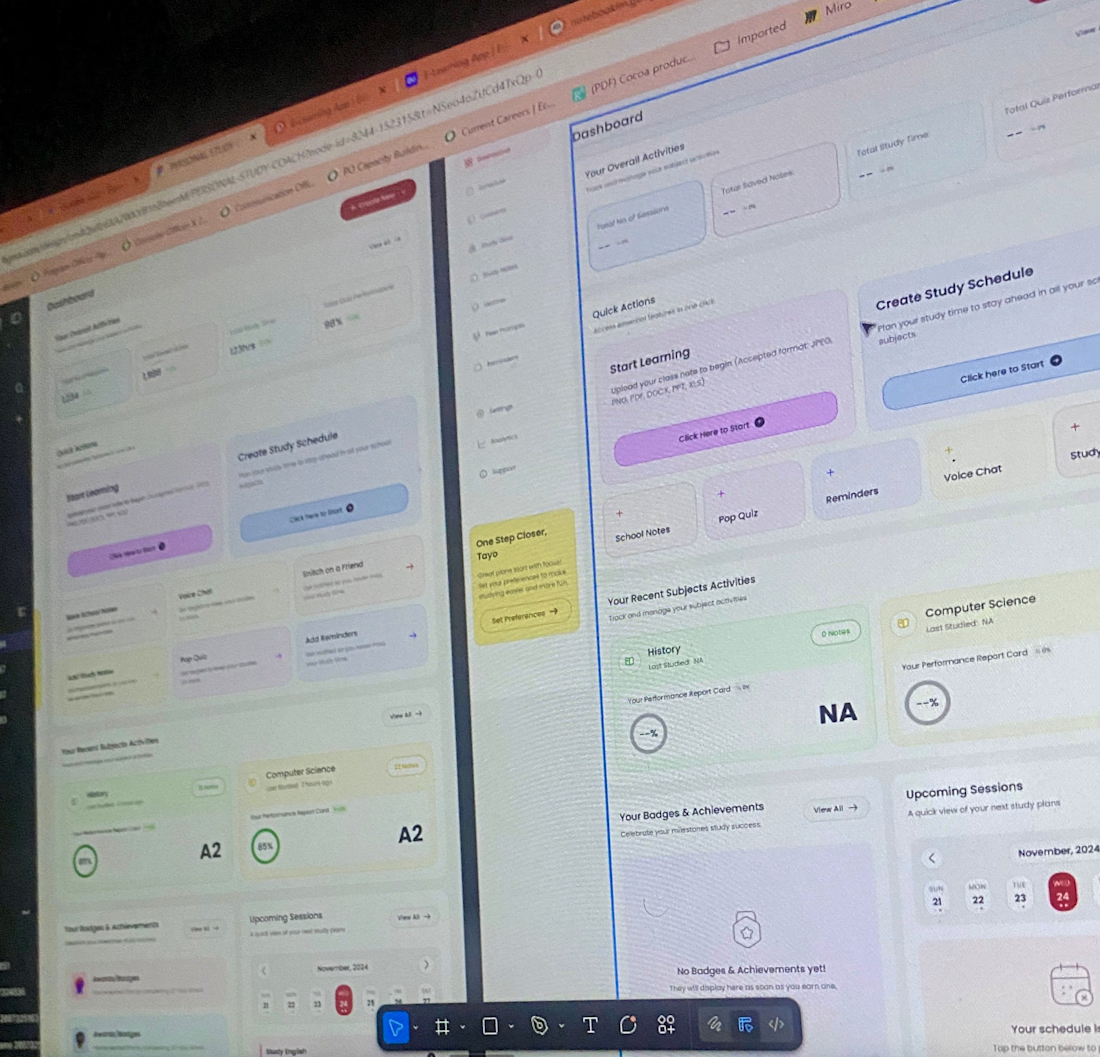
Students Learning performance, engagement, and outcomes to be structured around real decision-makin and learning progression.
To ensure the structure supports how decisions are actually made.
For Velarius Consulting, I explored two dashboard directions.
Same data. Different hierarchy.
Testing how structure changes clarity, scanning speed, and action flow.
• The focus?
Clear grouping.
Stronger visual priority.
More intentional quick actions.
Reduced visual competition between sections.
Dashboards aren’t about showing everything.
They’re about guiding attention to what matters first.
• What I’m validating?
Which layout makes decisions feel faster and more confident at a glance.
Still early — but structure > styling.
PS: The color usage was part of the requirement.

Love this exploration. Same data rarely means same decisions — structure fundamentally shapes interpretation and behavior.


Trending
maxearnings
The next frontier of payments is live on Contra. How are you maximizing revenue?
micrographics
Micrographics started as utility - barcodes, packaging, instruction labels. How would you use them?
aidesignflow
AI tools are redefining how designer work. What does your workflow look like?
aivideo
AI video tools are moving at warp speed. What tools are you using?
whennotai
As AI accelerates, creative judgment matters more. What part of your work stays human?