The network for creativity
Join 1.25M professional creatives like you
Connect with clients, get discovered, and run your business 100% commission-free
Creatives on Contra have earned over $150M and we are just getting started
Back to feedPost

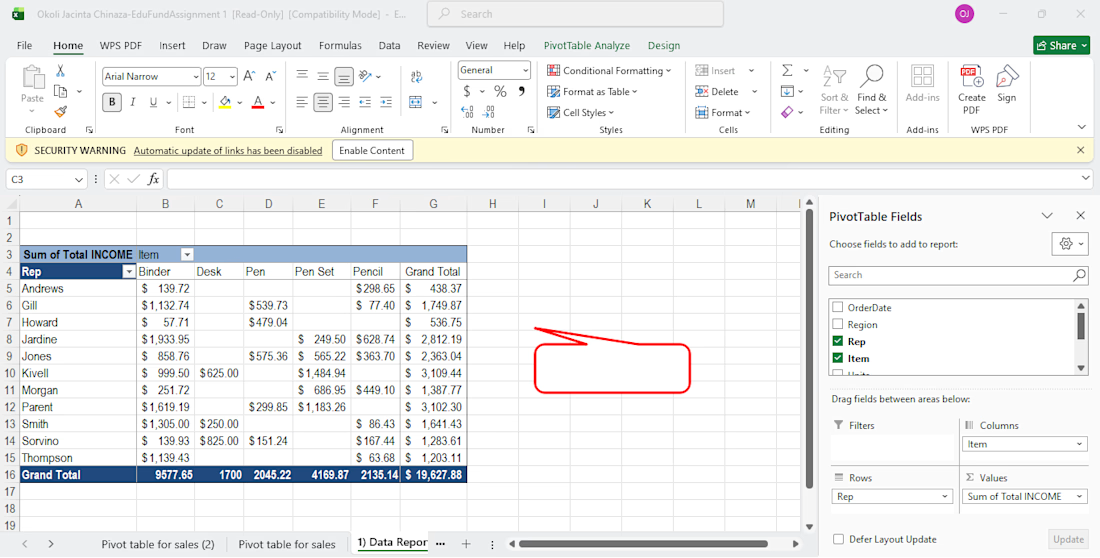
Sales Performance Analysis using Excel Pivot Tables
Analyzed sales performance data using Excel Pivot Tables to identify revenue contribution across sales representatives and product categories. Built interactive summaries to compare individual sales performance, product demand, and overall business revenue.
Tools Used:
- Microsoft Excel
- Pivot Tables
- Pivot Charts
- Data Aggregation
- Business Reporting
My Contributions:
- Structured raw sales data for analysis.
- Built Pivot Tables to summarize sales by:
- Sales Representatives
- Product Categories
- Revenue Contribution
- Created dynamic reports to compare performance across products and team members.
- Used Excel aggregation functions to generate business insights from transactional data.
Key Insights:
Identified top-performing sales representatives.
Determined highest revenue-generating product categories.
Highlighted sales concentration across products and personnel.
Business Value:
The analysis provided management with a quick overview of sales performance and product contribution, enabling data-driven decisions around sales strategy and resource allocation.

The network for creativity
Join 1.25M professional creatives like you
Connect with clients, get discovered, and run your business 100% commission-free
Creatives on Contra have earned over $150M and we are just getting started
Trending
retrofuturism
Share your favorite designs from the past exploring the distant future. Or your own take on the aesthetic 🚀
halftone
Dots. Texture. Grain. Let's see your designs using the halftone technique.

Midjourney
Creatives are showing off what they're making with Midjourney.
colorgrade
Video editors sound off: How do you enhance the mood of your video in color grading?





Related posts

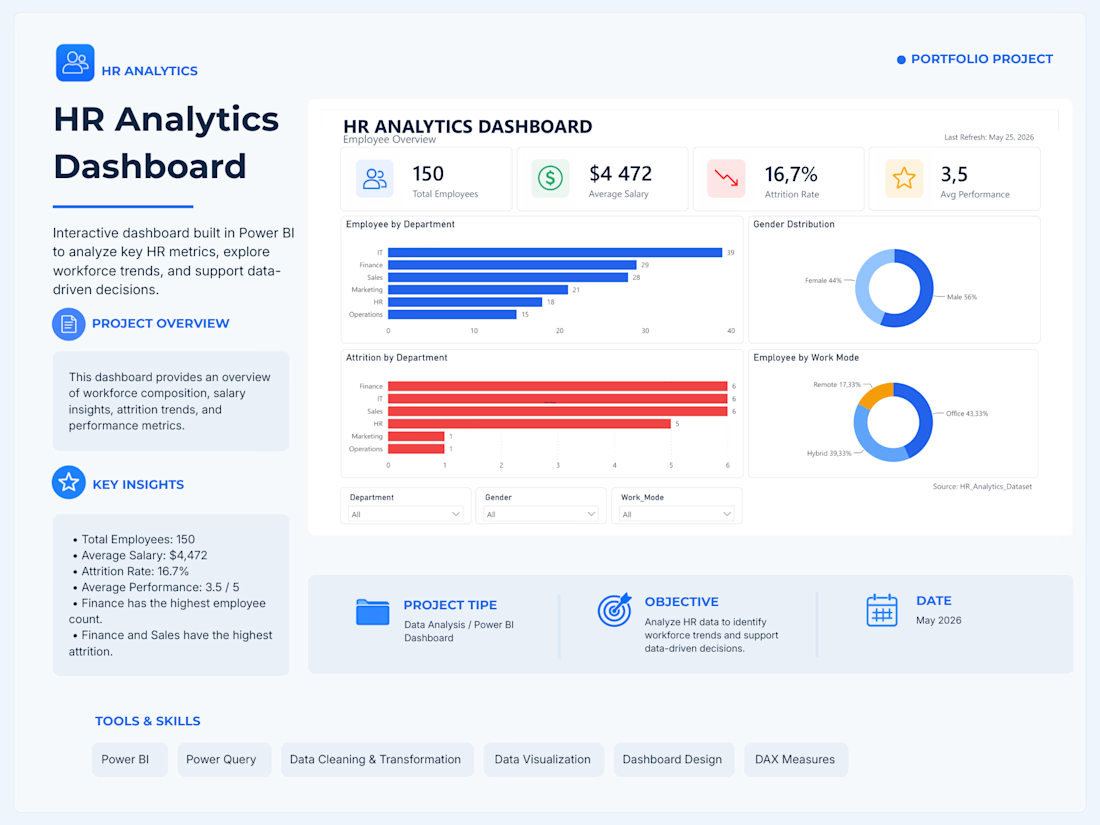
Power BI dashboard created to analyze HR metrics such as employee count, salary, attrition, work modes, and performance, helping identify trends and support decision-making.


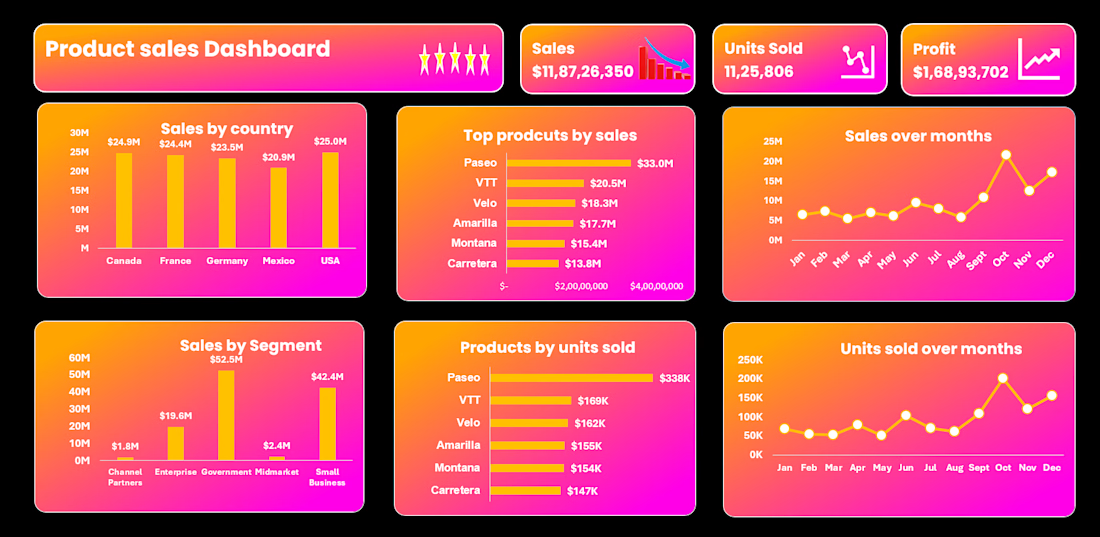
Your business probably needs an Excel dashboard if...
You answer "Yes" to 3 or more of these:
□ You create the same report every week.
□ You copy and paste data manually.
□ Your reports take over an hour to prepare.
□ Your team works with multiple spreadsheets.
□ Finding one KPI takes several minutes.
□ Management frequently asks for updated numbers.
If this sounds familiar, the problem is not in Excel.
The problem is the reporting process.
The right dashboard can automate repetitive work and make data easier to understand.
P.S. If you want to track your business performance with excel dashboard then DM me now.

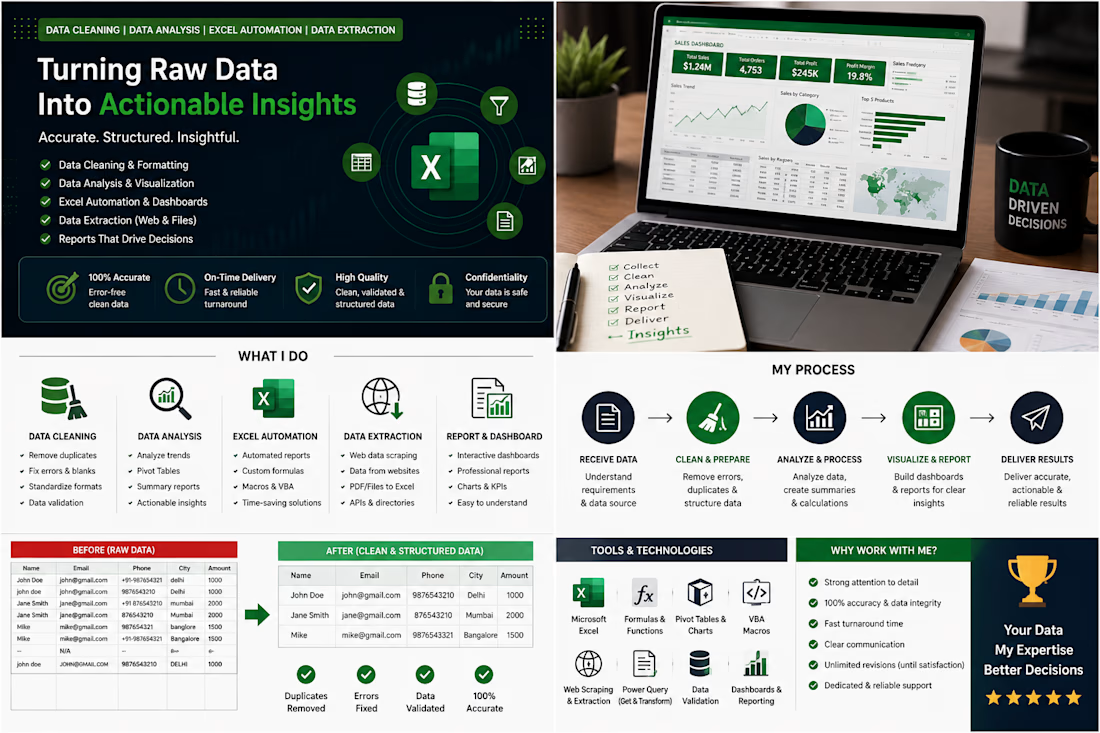
📊 Turning Raw Data Into Clear, Actionable Insights
Data is only valuable when it is accurate, organized, and easy to understand. I help businesses, professionals, and teams transform messy, unstructured data into reliable information that supports smarter decisions.
I specialize in Data Cleaning, Data Analysis, Excel Automation, and Data Extraction, with a strong focus on accuracy, efficiency, and practical business results.
🧹 Data Cleaning & Formatting
I clean and organize raw datasets by:
Removing duplicate and unnecessary records
Fixing errors, missing values, and inconsistencies
Standardizing dates, names, numbers, and formats
Validating data for accuracy and completeness
Structuring spreadsheets for easier analysis
Preparing datasets for reporting and decision-making
📈 Data Analysis & Reporting
I turn cleaned data into meaningful insights using:
Microsoft Excel formulas and functions
Pivot Tables and Pivot Charts
KPI calculations and summaries
Trend and performance analysis
Data visualization
Interactive dashboards
Professional reports and management summaries
⚙️ Excel Automation
I build efficient Excel solutions that reduce repetitive manual work, including:
Automated reports
Dynamic dashboards
Advanced formulas
Data validation systems
Automated calculations
Power Query workflows
Repeatable data-processing solutions
The goal is simple: save time, reduce errors, and make your workflow more efficient.
🌐 Data Extraction
I can extract and organize information from different sources, including:
Websites and online databases
Web-based business information
PDF and document files
Large datasets
Multiple data sources requiring consolidation
Raw extracted information is transformed into clean, structured, Excel-ready data.
📊 From Raw Data to Results
My typical workflow is:
Raw Data → Clean & Validate → Analyze → Visualize → Report → Actionable Insights
Whether you have a messy Excel spreadsheet, a large dataset that needs cleaning, repetitive reporting work, or information that needs to be extracted and structured, I focus on delivering results that are accurate, organized, reliable, and easy to use.
💼 Why Work With Me?
✔️ Strong attention to detail
✔️ Accurate and well-structured data
✔️ Efficient Excel solutions
✔️ Clear and professional reporting
✔️ Reliable turnaround
✔️ Focus on data quality and consistency
✔️ Practical solutions tailored to your requirements
Your data shouldn't just sit in a spreadsheet — it should help you make better decisions.
📩 If you have raw, messy, or unorganized data, I can help turn it into clean data, clear insights, and actionable results.
#DataCleaning #DataAnalysis #MicrosoftExcel #ExcelAutomation #DataExtraction #ExcelDashboard #PivotTables #DataVisualization #PowerQuery #DataAnalytics #WebDataExtraction #BusinessAnalytics #Freelancer