The network for creativity
Join 1.25M professional creatives like you
Connect with clients, get discovered, and run your business 100% commission-free
Creatives on Contra have earned over $150M and we are just getting started
Back to feedPost

Most companies now spend real money on AI and have almost no idea where it goes. Which team, which model, which workflow, and whether any of it is working.
So I designed the dashboard that answers it.
A finance lead opens it and sees spend against budget and a forecast for month end. A people lead opens it and sees adoption by team, who the power users are, and which licensed seats have gone quiet. Same product, different question, no digging.

The network for creativity
Join 1.25M professional creatives like you
Connect with clients, get discovered, and run your business 100% commission-free
Creatives on Contra have earned over $150M and we are just getting started



Related posts

🎨 Brand and web design for Nura, the AI tool for real estate
See Case Study here


Amazing work

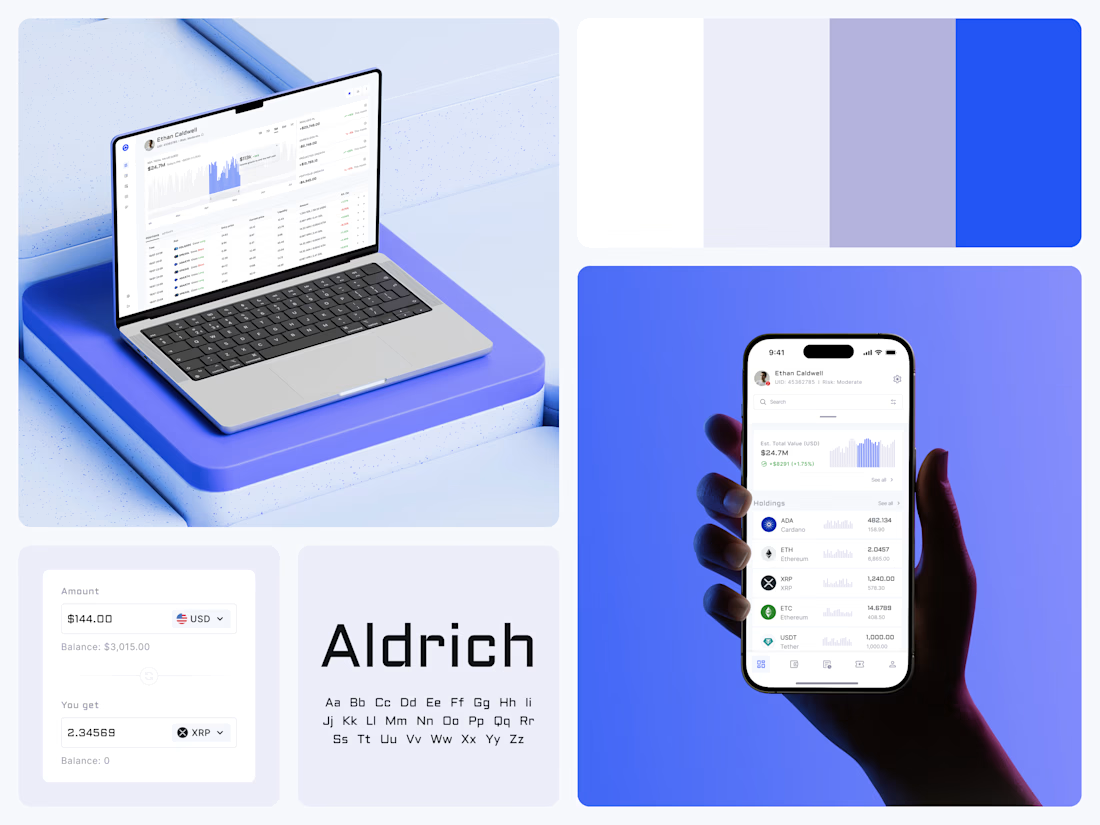
Crypto Portfolio Dashboard
Blue means one thing here: the range you are looking at.
The value chart is a row of thin gray bars, and only the selected date range fills in blue. You read the period that matters and keep the months around it as context.
The phone carries the same chart above the holdings list. Each coin gets its own small bar chart between the name and the amount, so you can scan the whole portfolio for movement without opening a single coin.
Trading screens get busy fast. This one stays light and calm, so the numbers lead: total value, realized and unrealized P&L and open positions, all on one screen.
Designed by the Hue & Machine team.
#Crypto #Fintech #DashboardDesign #TradingPlatform #DataVisualization #UIDesign #ProductDesign #WebApp #MobileDesign #FigmaDesign



Nice Ui Dmytro


Kalotės Pušynas, a gated quarter of modern houses.
I created the identity and the website. A wordmark that joins modern and classic, a deep blue and cream palette with four steps of blue, kalotespusynas.lt where buyers choose their house plot by plot, and everything the sales team hands over on site.
Check - Full Case Study

Great