The network for creativity
Join 1.25M professional creatives like you
Connect with clients, get discovered, and run your business 100% commission-free
Creatives on Contra have earned over $150M and we are just getting started
Back to feedPost
A few weeks ago, my boss Victor Ugwu shared a raw supply chain dataset with me.
No instructions.
No predefined questions.
Just one brief: “See what you can uncover.”
Instead of treating it as routine reporting, I approached it as a real business problem:
How can leadership use this data to reduce risk, cut costs, and grow profitably?
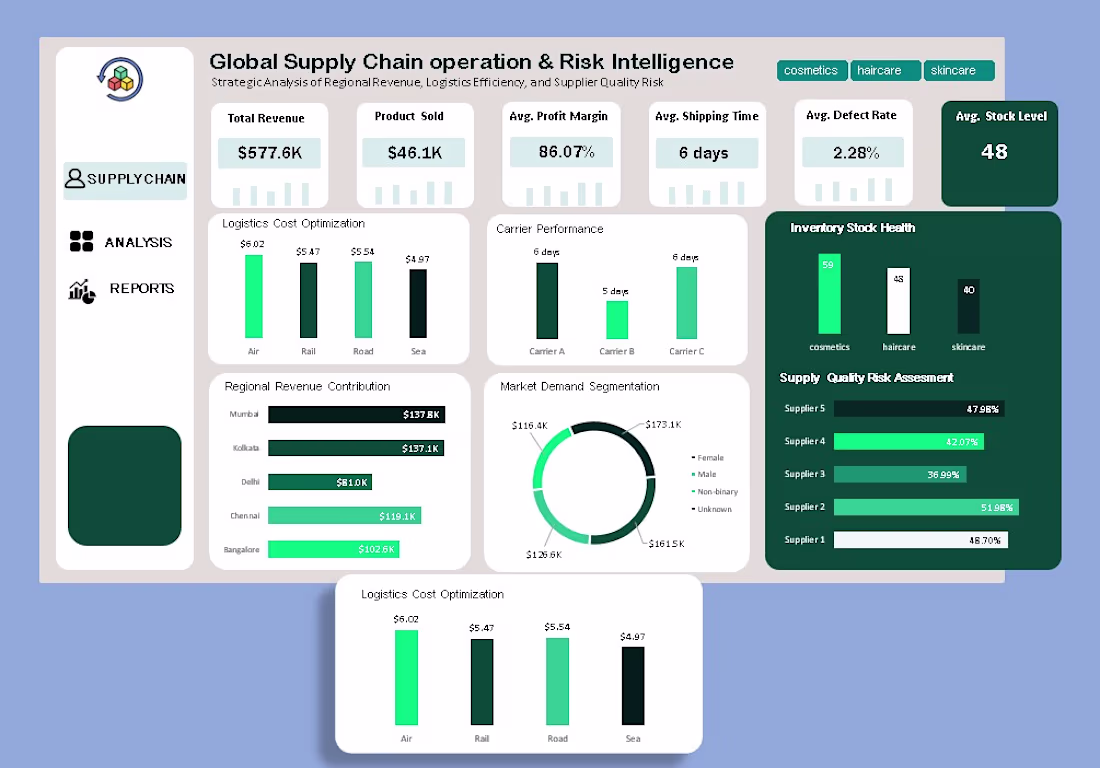
That mindset led to the Global Supply Chain Operations & Risk Intelligence Dashboard, built entirely in Excel.
At first glance, the data looked fine. But beneath the tables were silent issues holding performance back: rising logistics costs, inconsistent carrier performance, hidden supplier quality risks, inventory imbalance across product lines, and revenue concentration in just a few regions. None of these were obvious from raw spreadsheets, so I redesigned the analysis around decision-making, not reporting.
Revenue visibility came first. By visualizing regional contributions, leadership can clearly see where growth is coming from. Cities like Mumbai and Kolkata emerge as key drivers, while other regions highlight the need for better distribution or demand stimulation. With $577.6K in total revenue and $46.1K in products sold, investment decisions become sharper and more focused.
Logistics efficiency followed. Comparing transport costs with delivery times showed that air freight is fast but expensive, while sea and rail offer better cost efficiency. This helps answer a critical question: Where can we cut costs without slowing deliveries?
Carrier performance revealed another insight. A one-day delivery difference may seem small, but at scale it affects customer satisfaction, inventory turnover, and holding costs. Making this visible enables smarter contract negotiations and volume rebalancing.
Inventory health also stood out. Stock levels varied across product lines cosmetics (59), haircare (48), skincare (40) highlighting risks of both overstock and stockouts.
One of the most critical findings was supplier quality risk, with some suppliers showing defect rates as high as 52%. Instead of reacting after complaints or returns, teams can now identify and mitigate risks early.
This analysis was done using Excel, Power Query, Pivot Tables, and calculated KPIs.
The result isn’t just a dashboard, it’s a decision engine that delivers clarity, cost savings, early risk detection, and smarter growth decisions.
If you’re a founder or operations leader dealing with rising costs or poor visibility, I help turn your data into clear, practical actions.
📩 DM me if you want to uncover the growth opportunities hidden in your data.
The network for creativity
Join 1.25M professional creatives like you
Connect with clients, get discovered, and run your business 100% commission-free
Creatives on Contra have earned over $150M and we are just getting started
Trending
Claude
Claude has entered the design space. How are you using Claude Design?
Contra University
Learn from expert creatives how to earn more using next-gen AI tools.
creativeaiflow
Creative AI workflows are evolving. What tools do you use, and what are their strengths and weaknesses?
freelancerlife
Freelancer life is wins, pivots, and everything in between. What’s yours right now?
Related posts
High performance should not mean running on instinct alone.
For Cortex, we explored a landing page for an AI-powered executive performance platform that helps leaders better understand stress, decision-making, and focus throughout the workday.
The challenge was to turn complex performance analytics into an experience that still feels premium and direct. We combined cinematic product storytelling with a clear SaaS conversion flow to create a focused, credible interface built for action.
How should performance data be presented to busy leaders: as a simple signal or as deeper context they can explore?
View the full project:
https://dribbble.com/shots/27578187-Cortex-Performance-Stress-Shield-Landing-Page
Love this!
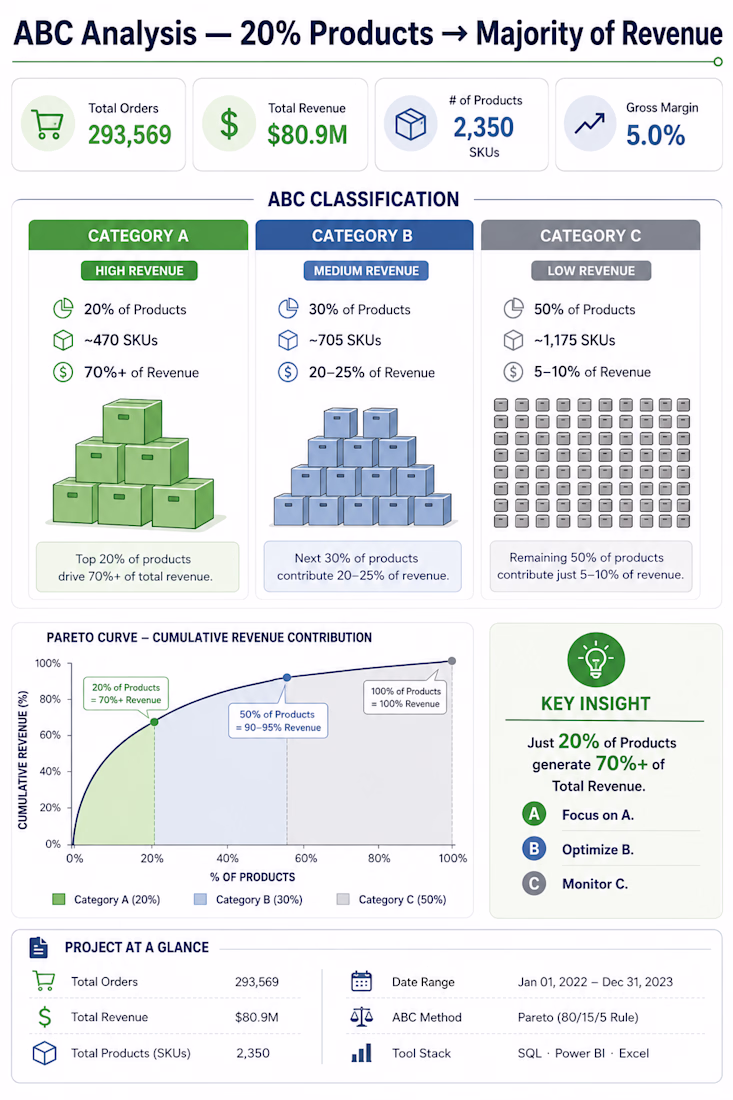
ABC Classification (Pareto Analysis) — SQL-Based Inventory Prioritization
Analyzed 293,569 orders and 2,350 SKUs to identify which products actually drive revenue — and which don't.
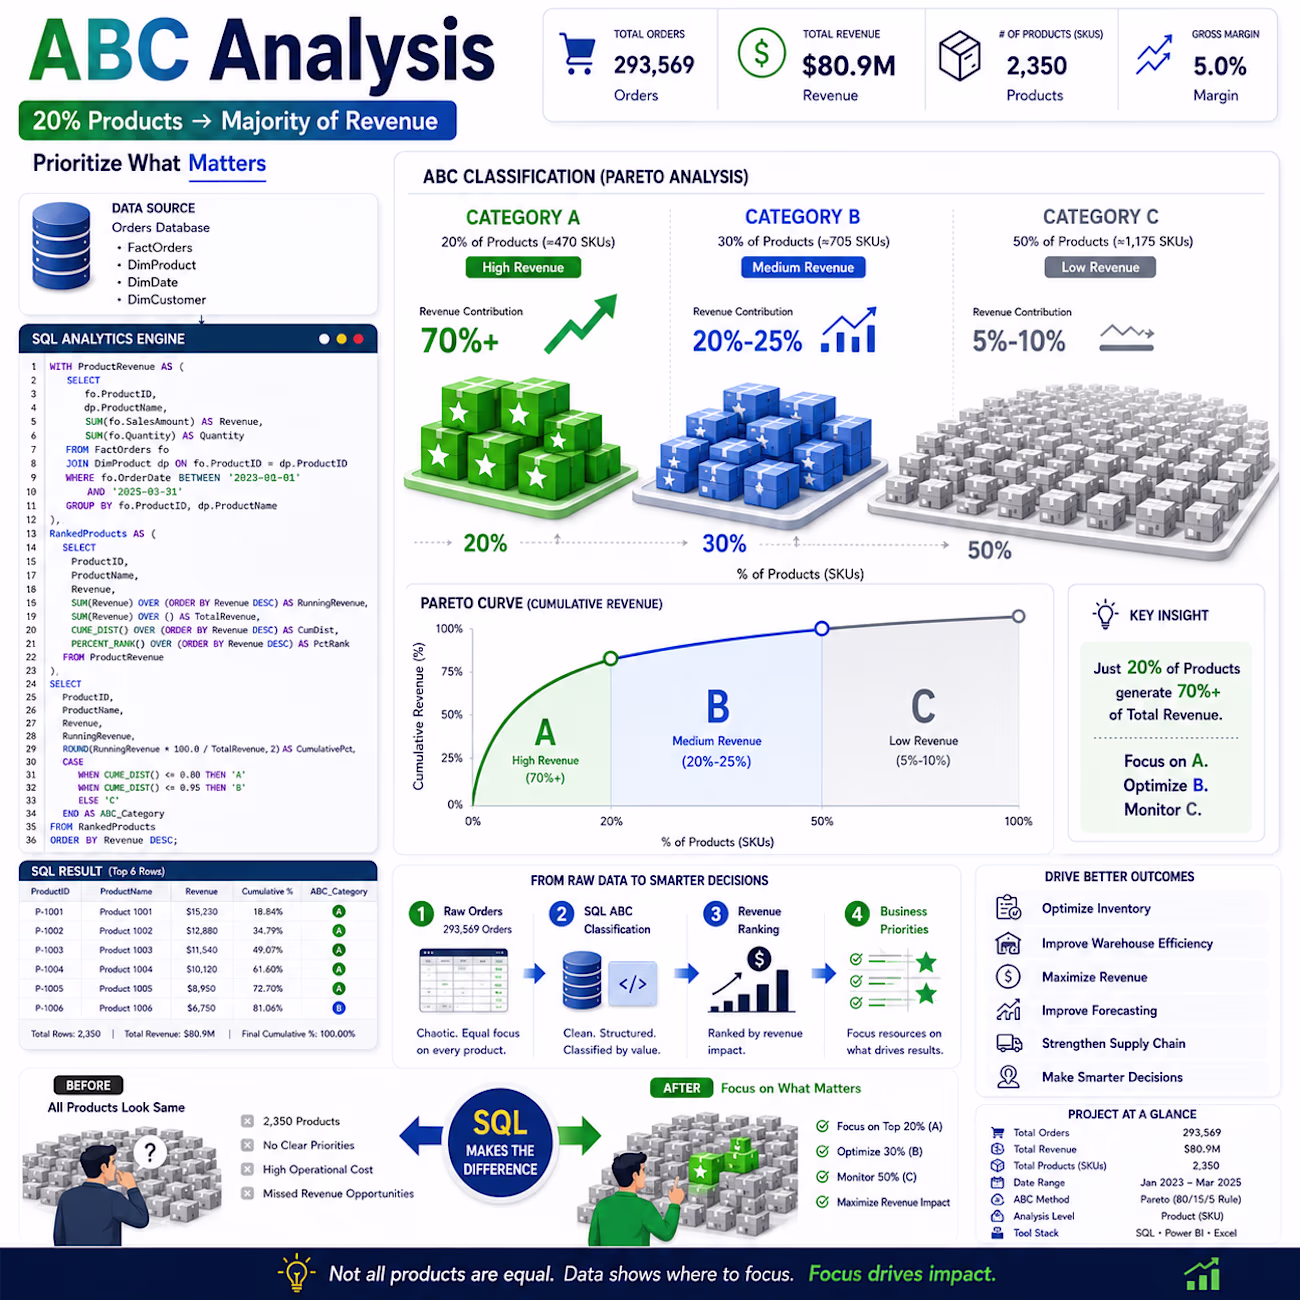
Approach:
Built a CTE-based ABC classification in SQL Server, ranking products by cumulative revenue contribution using window functions (SUM() OVER, CUME_DIST(), PERCENT_RANK()), then segmented into three tiers based on Pareto thresholds.
Result:
Category A (20% of products) → 70%+ of total revenue
Category B (30% of products) → 20-25% of revenue
Category C (50% of products) → 5-10% of revenue
Business impact:
This reprioritizes where operational effort should go — tighter stock monitoring and faster reordering for Category A, reduced tracking overhead for Category C. The same logic fed into a related late-delivery root cause analysis on the same dataset.
Stack: SQL Server · Tableau
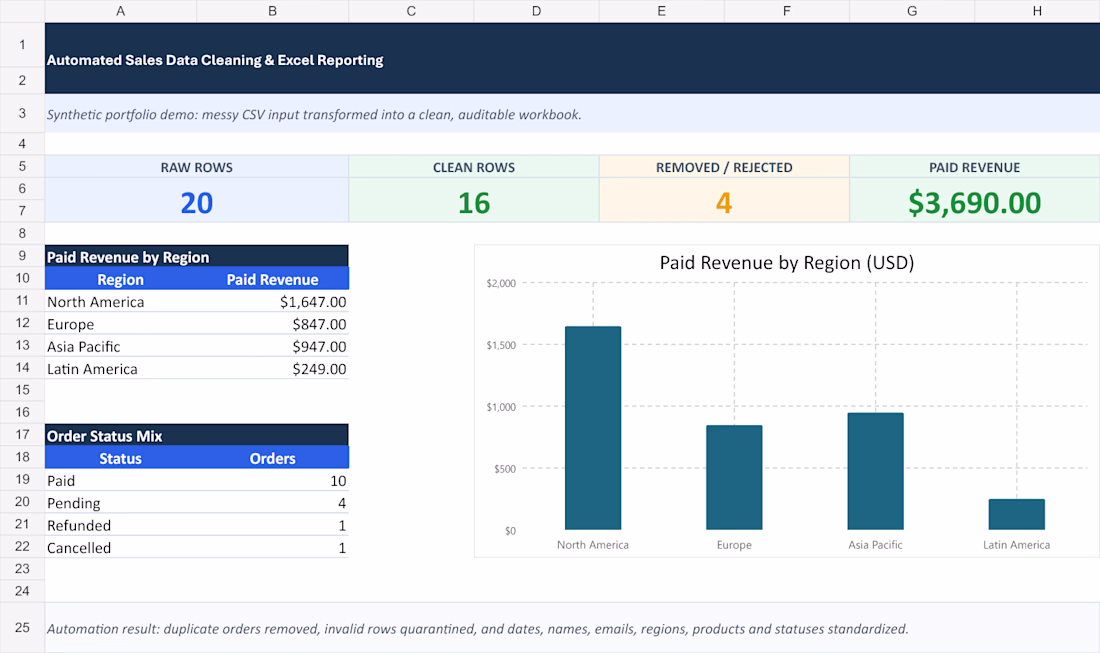
I built a small data-cleaning workflow around one simple rule: bad rows should never silently disappear.
Synthetic demo results:
• 20 raw order records
• 16 clean rows
• 2 duplicates removed
• 2 invalid rows quarantined
• $3,690 paid revenue reconciled
The output includes a clean CSV, a rejected-row file, an audit log, and an Excel dashboard. Dates, names, emails, regions, products, and payment statuses are standardized.
The key design choice is quarantine + reasons, not just dropping bad rows and exporting. That lets a reviewer trace exactly what changed and decide whether rejected records should be repaired.
For recurring exports, what needs the most manual review in your workflow: duplicates, inconsistent labels, or invalid amounts and dates?