The network for creativity
Join 1.25M professional creatives like you
Connect with clients, get discovered, and run your business 100% commission-free
Creatives on Contra have earned over $150M and we are just getting started
Back to feedPost

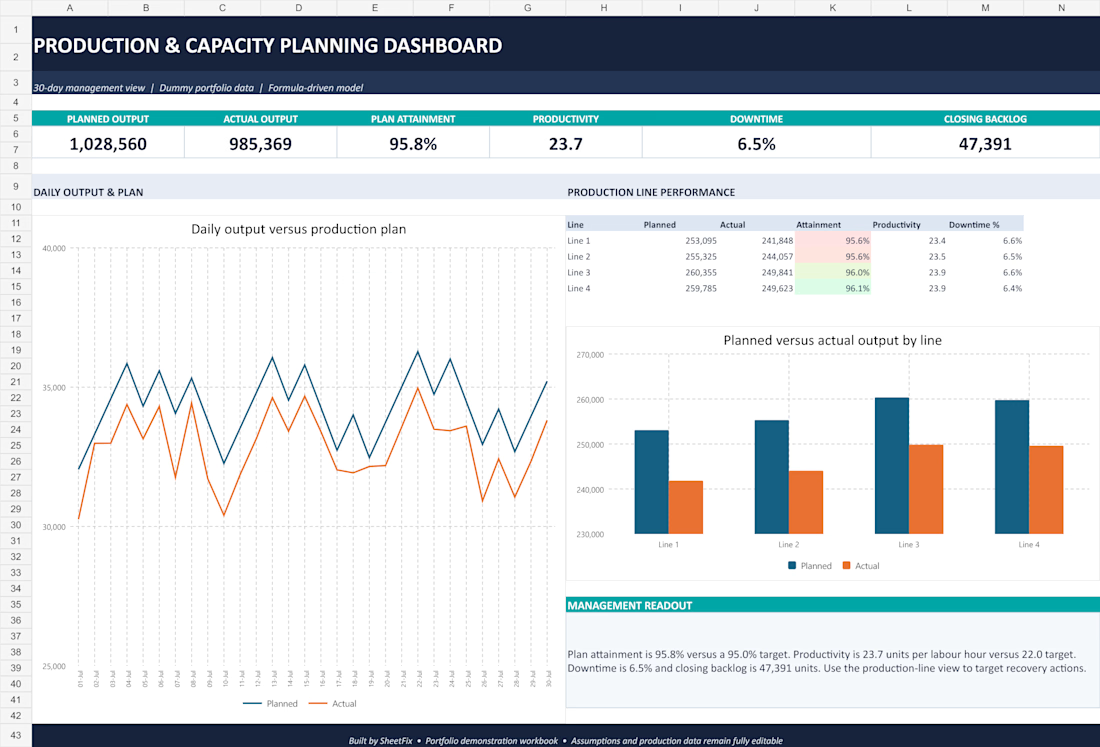
Production teams often have plenty of operational data but still spend hours turning it into useful management reporting.
I built this editable Excel production dashboard to provide a clear 30-day view of:
• Planned versus actual output
• Plan attainment
• Labour productivity
• Downtime
• Closing backlog
• Performance by production line
The assumptions, targets and production records remain fully editable. This is a working Excel tool, not a static mock-up.
If your production reporting is manual, slow or difficult to interpret, send me a message. I can review an anonymised example and suggest what could be improved.

The network for creativity
Join 1.25M professional creatives like you
Connect with clients, get discovered, and run your business 100% commission-free
Creatives on Contra have earned over $150M and we are just getting started


Trending
retrofuturism
Share your favorite designs from the past exploring the distant future. Or your own take on the aesthetic 🚀
halftone
Dots. Texture. Grain. Let's see your designs using the halftone technique.

Midjourney
Creatives are showing off what they're making with Midjourney.
colorgrade
Video editors sound off: How do you enhance the mood of your video in color grading?
Related posts

When does a sports dashboard need the court to be more than a background?
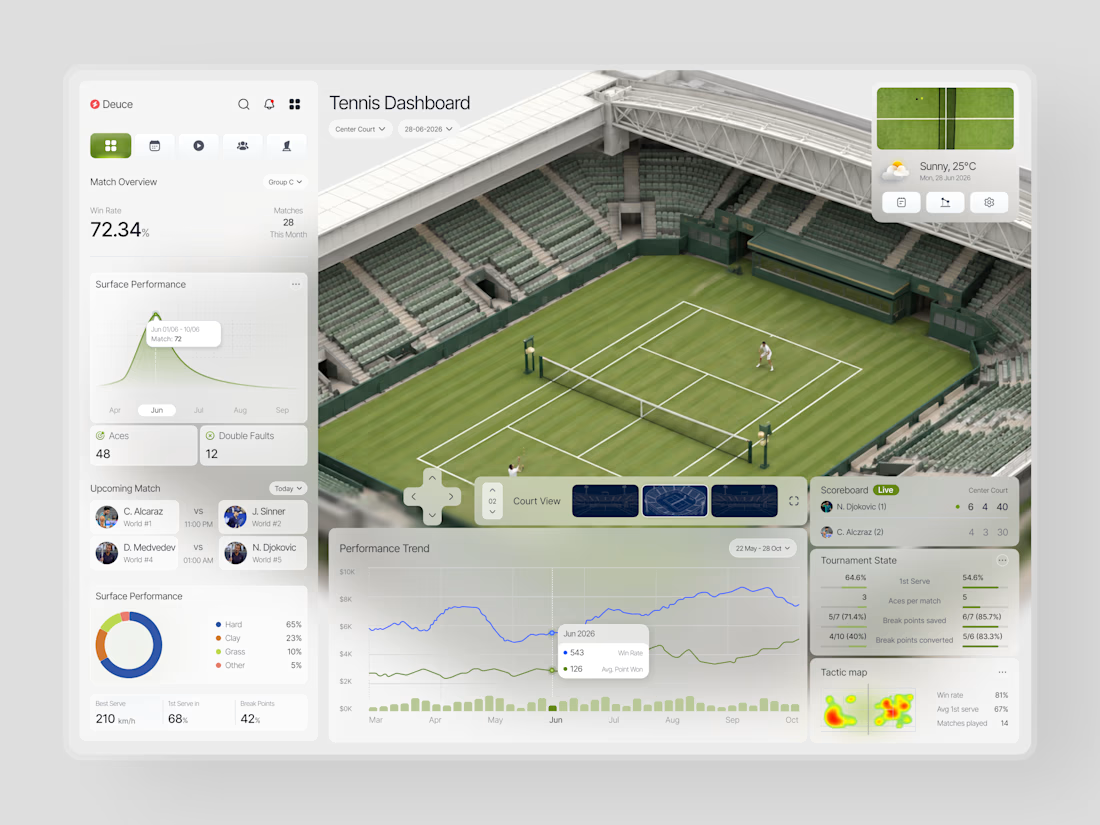
In this case, we were designing Deuce a tennis analytics platform that needed to make complex match data feel immediate and spatial, not just numerical.
The brief was clear: analysts and coaches don't just want stats. They want to feel like they're watching the match while reading the data.
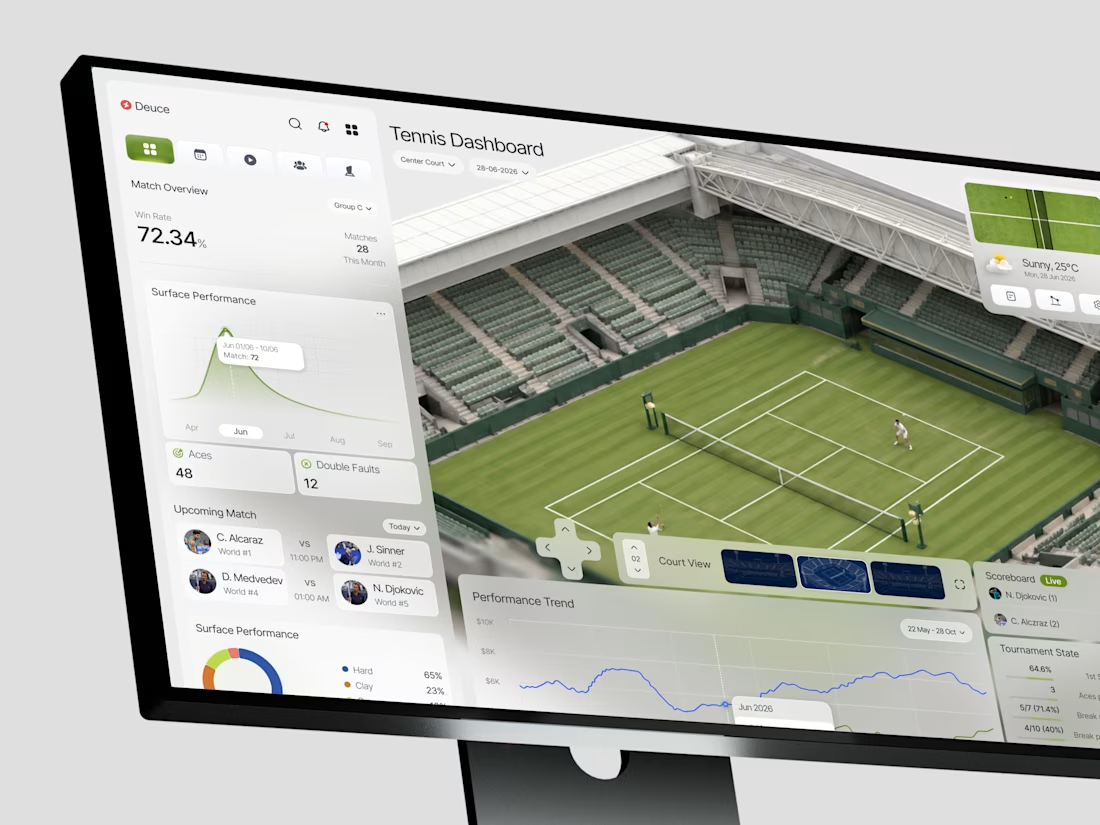
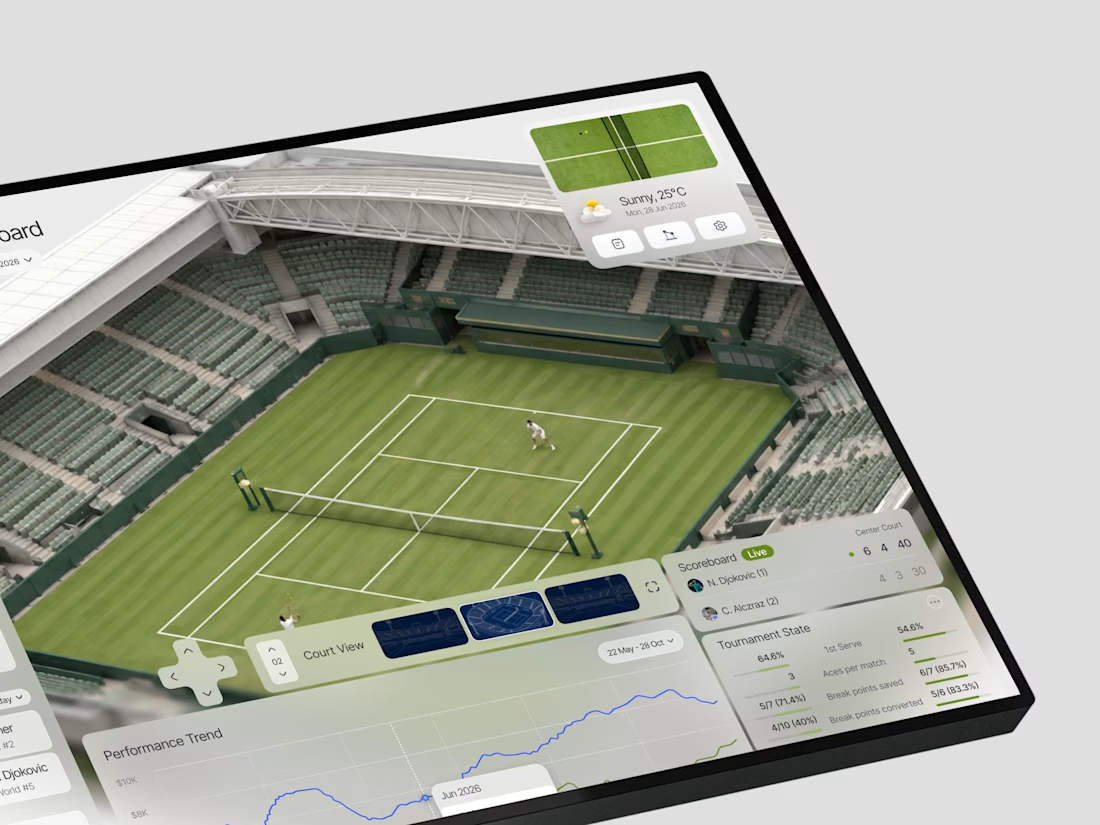
So we made the Wimbledon court the literal center of the interface. Every panel orbits it match overview and surface performance on the left, live scoreboard and tournament state on the right, performance trend running the full width below. The court isn't decoration. It's the anchor that makes every number feel like it belongs to a real moment on a real surface.
72.34% win rate. 48 aces. 210 km/h best serve. Djokovic leading Alcaraz 6-4 on Center Court. Alcaraz vs Sinner tonight at 11 PM. Tactic heatmaps showing where points are won and lost.
What we noticed was that spatial context changed how the data felt. The same numbers in a standard table read as analysis. Wrapped around a court, they read as intelligence.
Do you think sports UI design is still underestimating how much context and spatial layout affect how data is understood?

Nice aesthetics, but composition feels bottom-heavy.

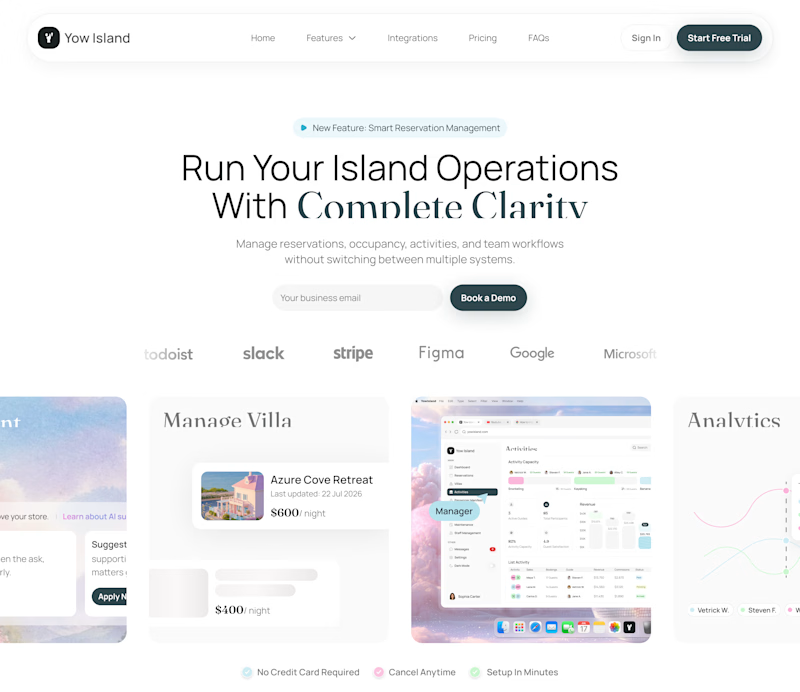
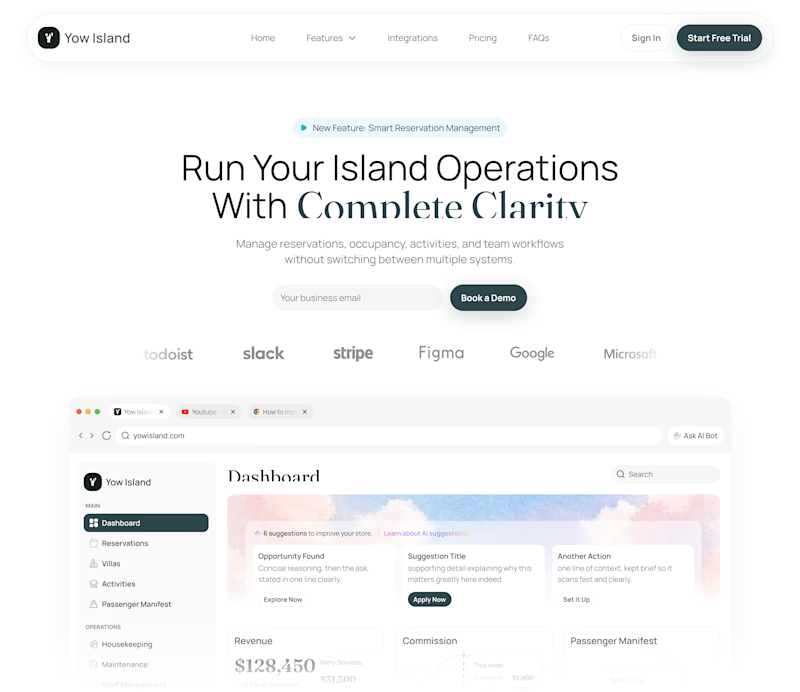
I've been exploring two hero directions for Yow Island, an island operations management platform.
- Version A uses multiple floating product previews to highlight the platform’s range of features and create a more dynamic first impression.
- Version B focuses on one large dashboard preview for a cleaner, more product-focused experience.
Same message, different visual approach - testing which direction communicates the product more clearly.
Which one would you choose: A or B?
4 voted
80%
1 voted
20%
5 votes
Closed

Cool work !

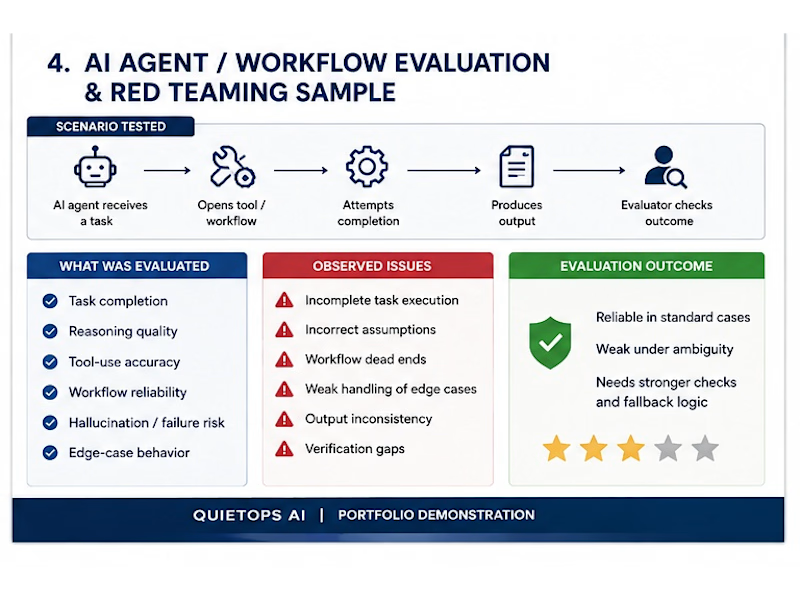
This portfolio sample shows how I evaluate AI agents and automated workflows to find reliability problems, broken logic, and weak edge-case handling. I review whether the system completes the intended task, uses tools correctly, follows instructions, handles ambiguity, and produces an output that can actually be trusted.
The work focuses on identifying failure points before they become real user problems, including incomplete task execution, incorrect assumptions, workflow dead ends, hallucinations, and verification gaps. This is a portfolio demonstration of my AI agent evaluation and red-teaming work. No confidential client information is included.



Thorough breakdown! Robust edge-case handling and reliability checks are definitely the trickiest part of building reliable AI agents 🤖📊