The network for creativity
Join 1.25M professional creatives like you
Connect with clients, get discovered, and run your business 100% commission-free
Creatives on Contra have earned over $150M and we are just getting started
Back to feedPost

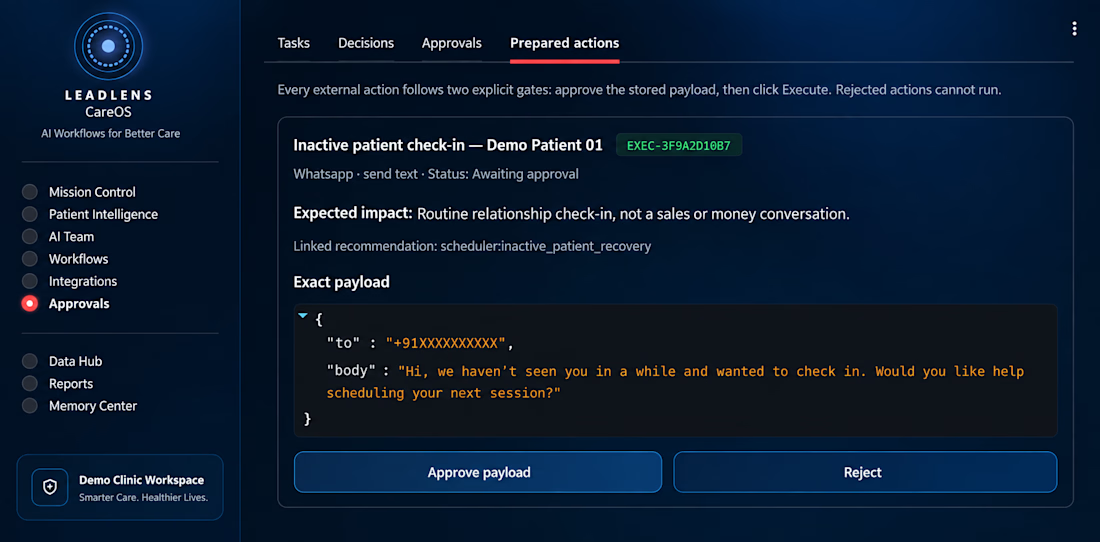
Built an approval-first AI workflow for LeadLens CareOS.
The system prepares customer-facing actions such as inactive-patient follow-ups, but nothing is sent automatically. Each action includes the exact payload, context, and expected impact, then waits for human approval before execution.
This is the type of AI automation I focus on: useful enough to reduce repetitive work, but controlled enough that businesses keep oversight of important actions.
Built with AI workflows, structured logic, approvals, CRM data, and business-process automation.


The network for creativity
Join 1.25M professional creatives like you
Connect with clients, get discovered, and run your business 100% commission-free
Creatives on Contra have earned over $150M and we are just getting started




Related posts

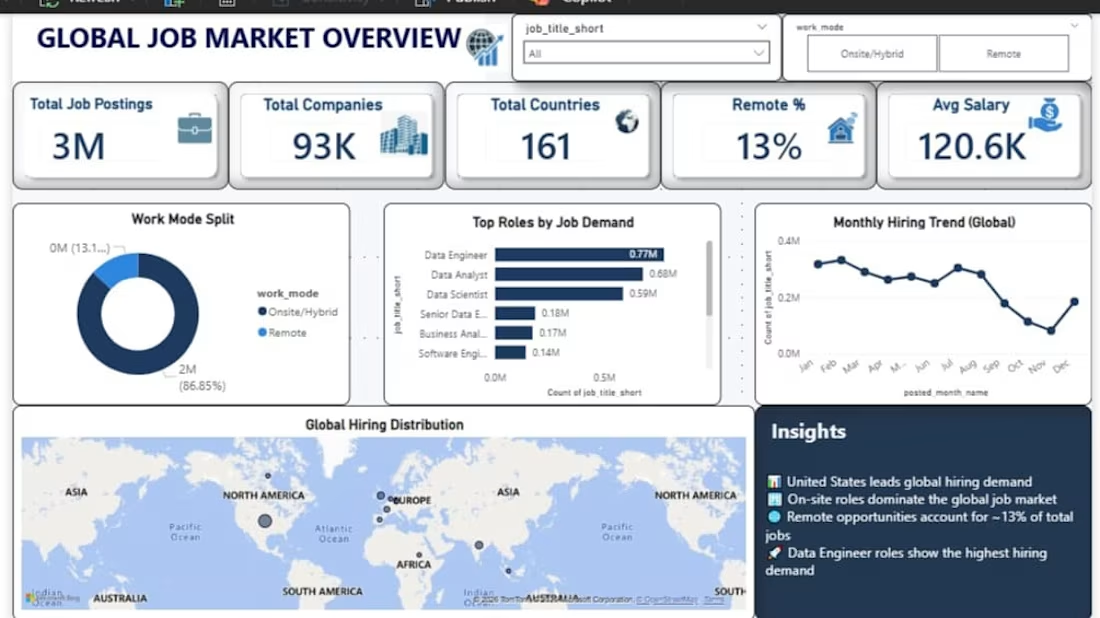
I analyzed 3M+ job postings across 161 countries and 93K companies to identify hiring trends, in-demand roles, work-mode patterns, and salary insights.
I used Python for data cleaning and preprocessing, SQL for analysis, and Power BI to build an interactive dashboard.
Key areas analyzed:
• Global hiring demand
• Top job roles by demand
• Remote vs. onsite/hybrid work patterns
• Average salary trends
• Monthly hiring trends
This project helped me turn a large dataset into clear, actionable insights for understanding the global job market.




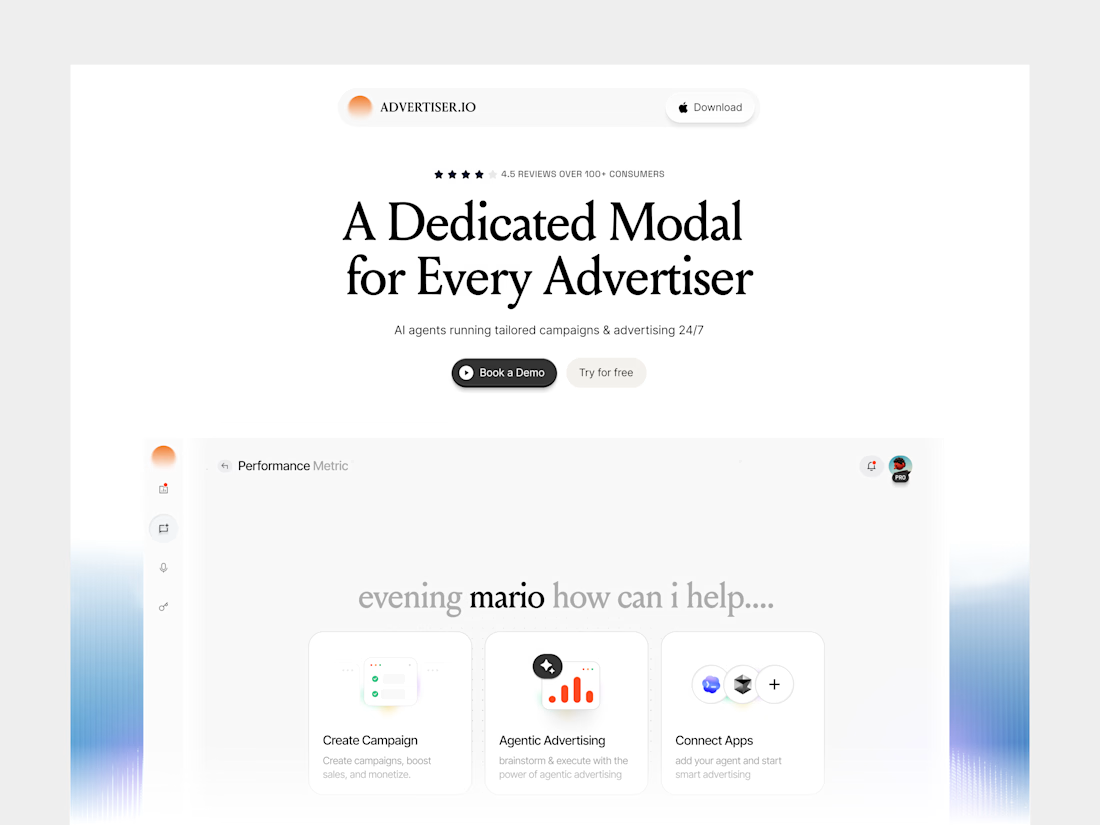
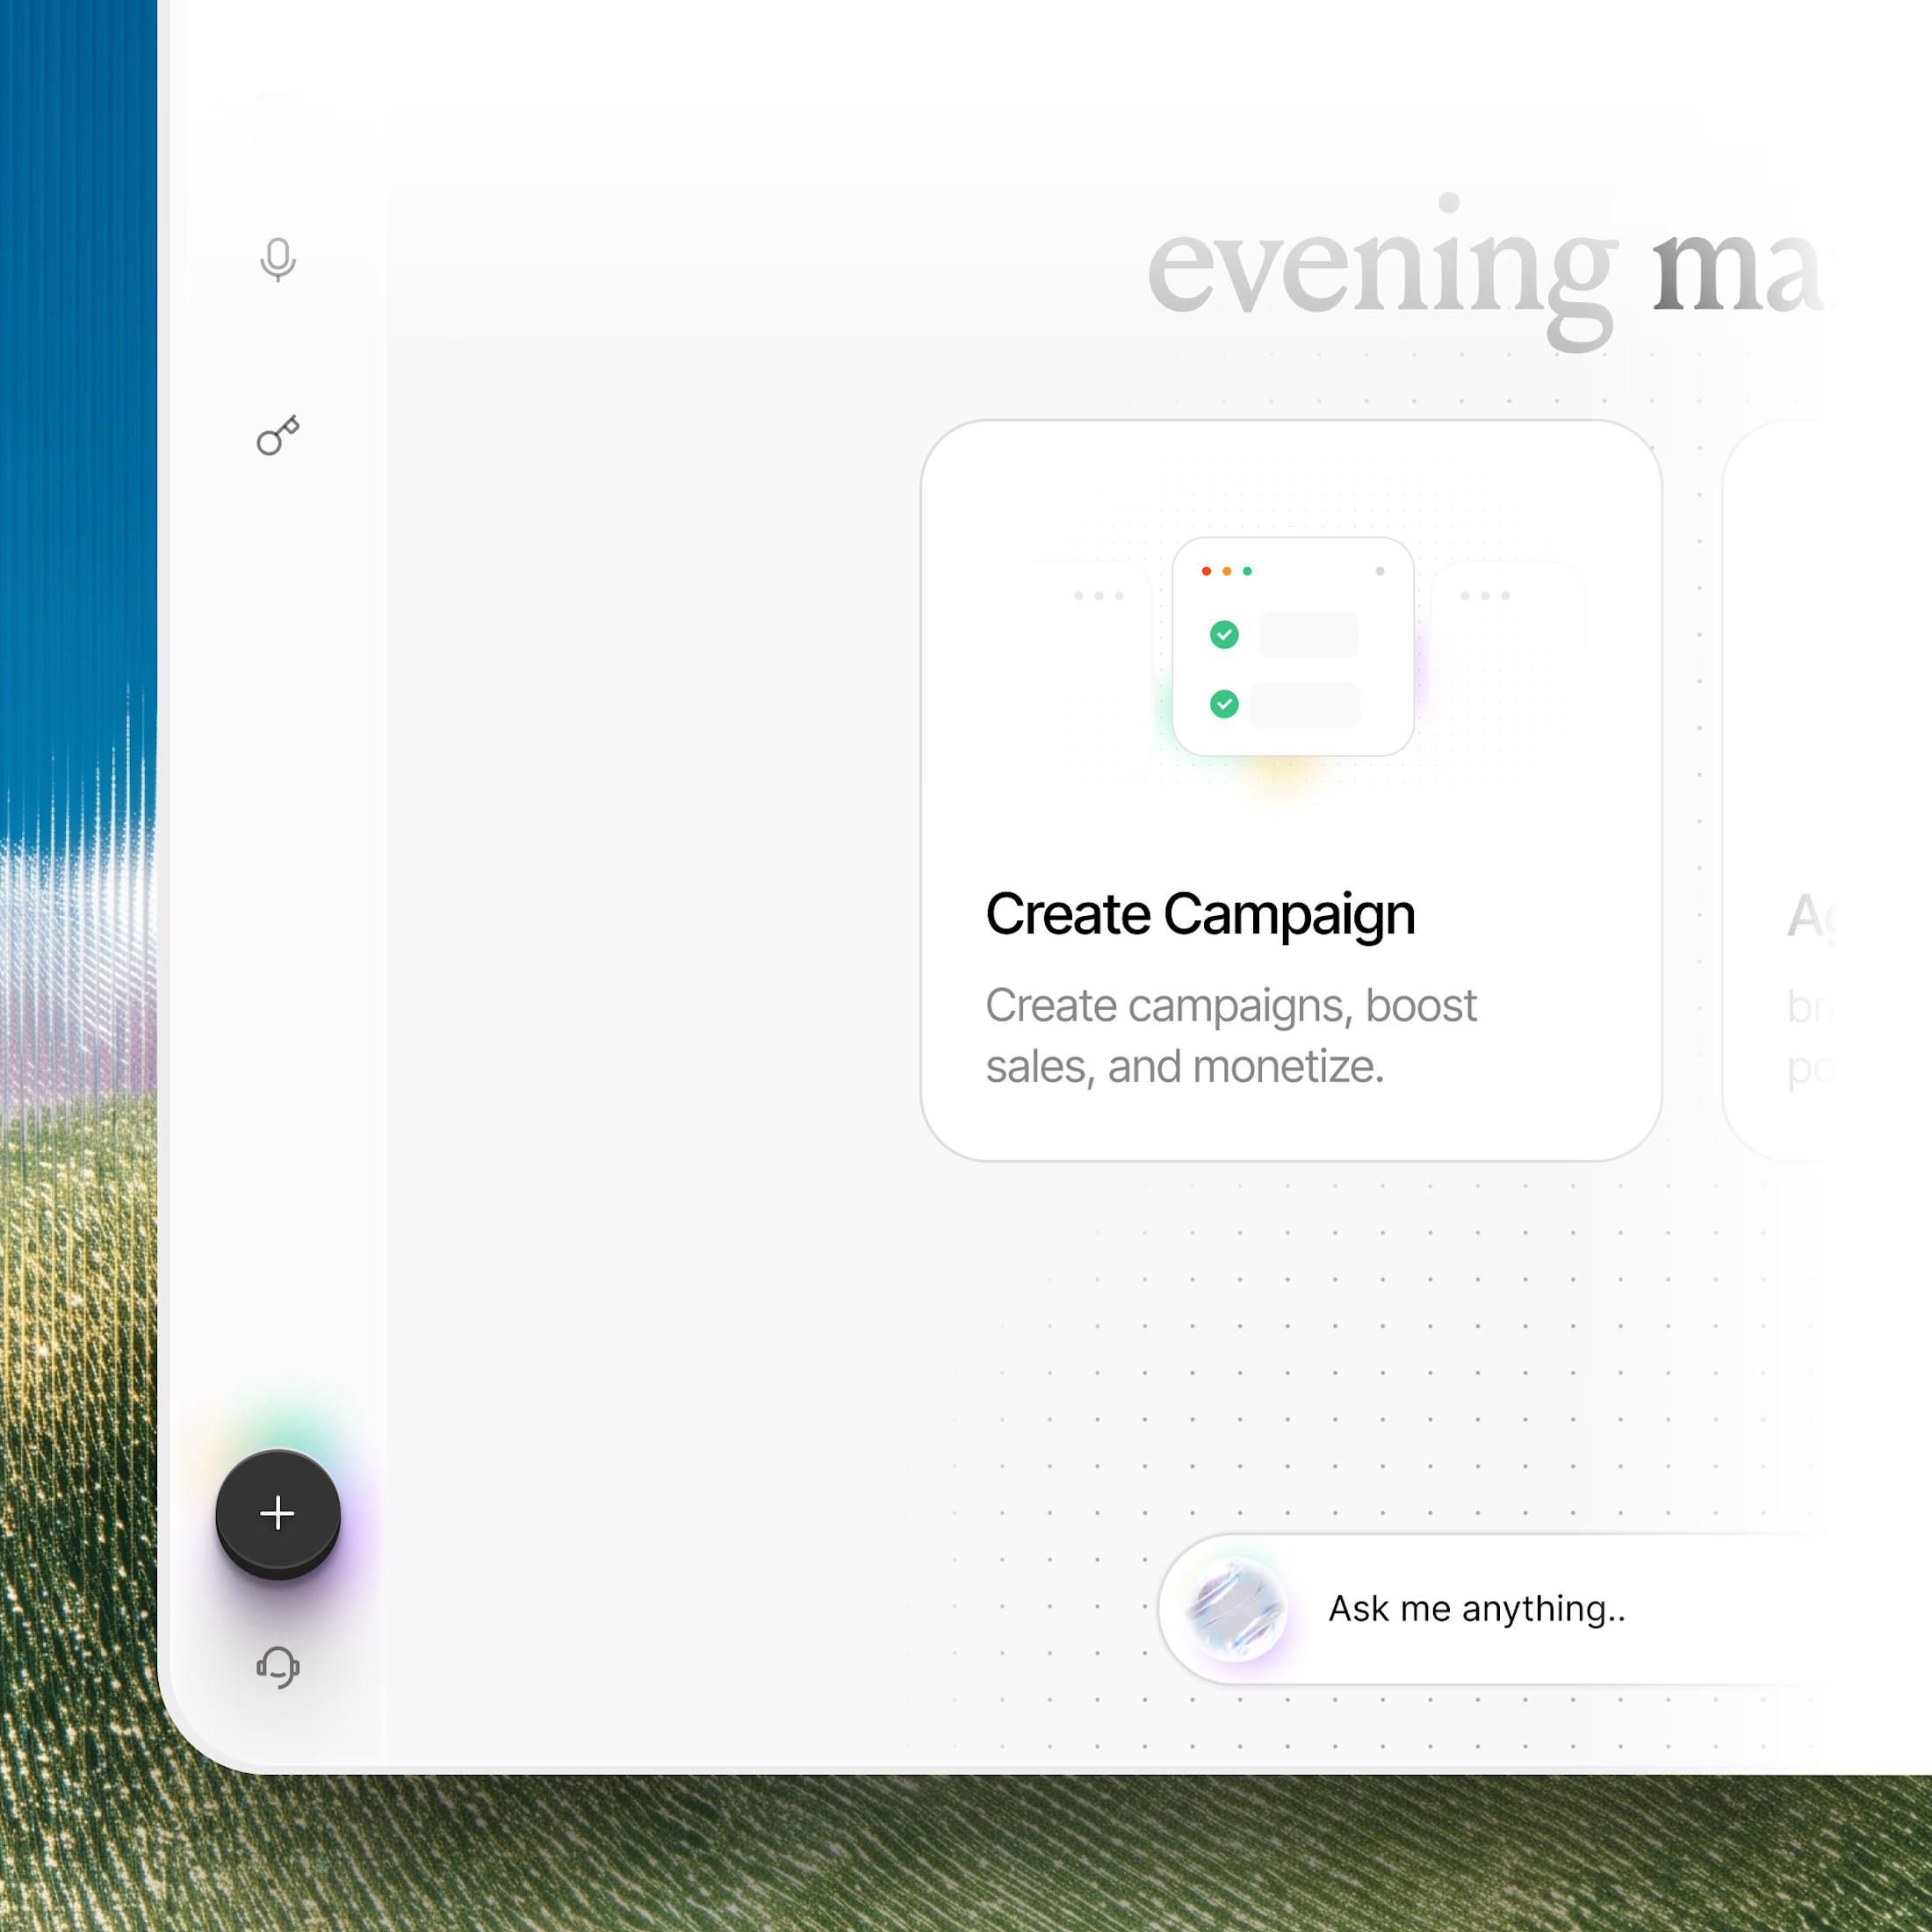
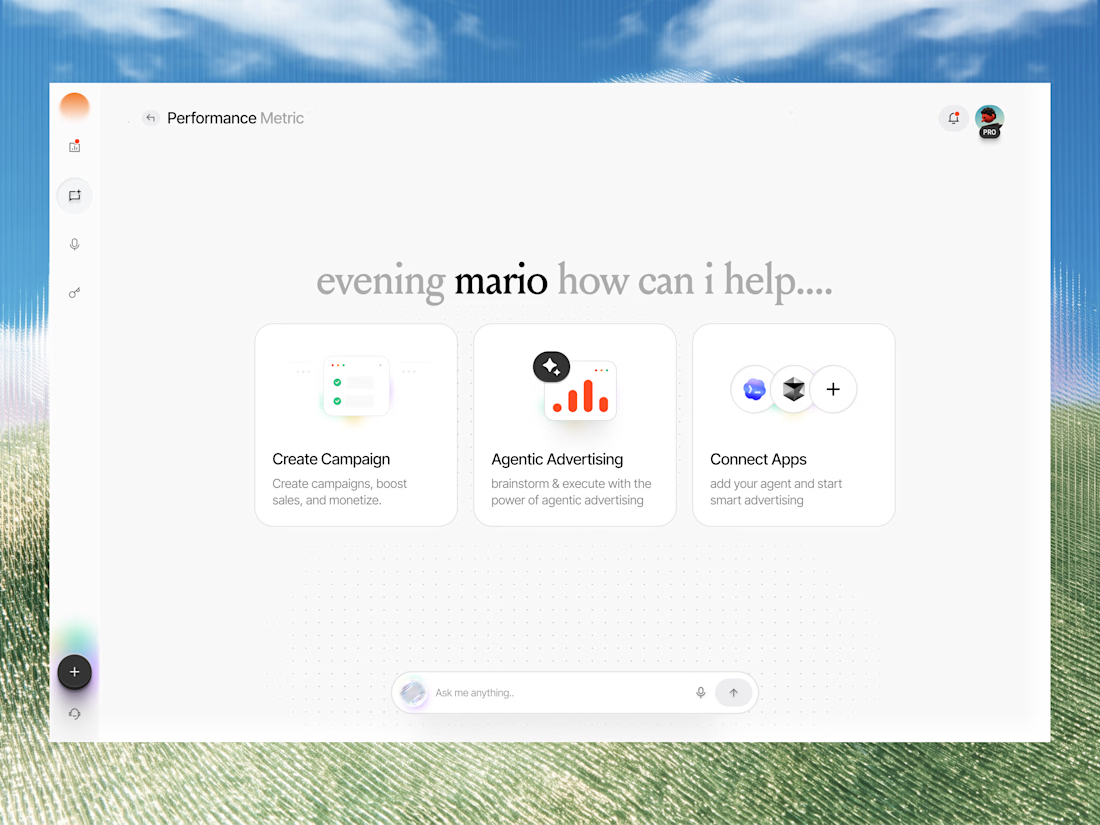

The dedicated modal keeps the advertiser story readable, and the Create Campaign cards stay consistent across the frames. The white field behind the type also gives the workflow enough air without losing the product UI.

AI-Assisted Sales Intelligence Dashboard
Project Overview
This project is an end-to-end Sales Analytics solution built using Python, SQL, and Power BI.
The workflow includes:
Data Cleaning using Python (Pandas)
Data Storage using SQLite
Business Analysis using SQL Queries
Interactive Dashboard using Power BI
Automated Business Report Generation using Python
The goal of this project is to analyze sales performance, identify profitable products, monitor regional performance, and generate business recommendations.
Dataset
Dataset: Sample Superstore Dataset
Records: 9,994
Features:
Order Details
Customer Information
Product Information
Sales
Profit
Discount
Region
Category
Sub-Category
Tools & Technologies
Python
Pandas
SQLite
SQL
Power BI
Data Visualization
Business Intelligence
Project Workflow
CSV Dataset
↓
Data Cleaning (Python)
↓
SQLite Database
↓
SQL Analysis
↓
Power BI Dashboard
↓
AI Business Report
Dashboard Pages
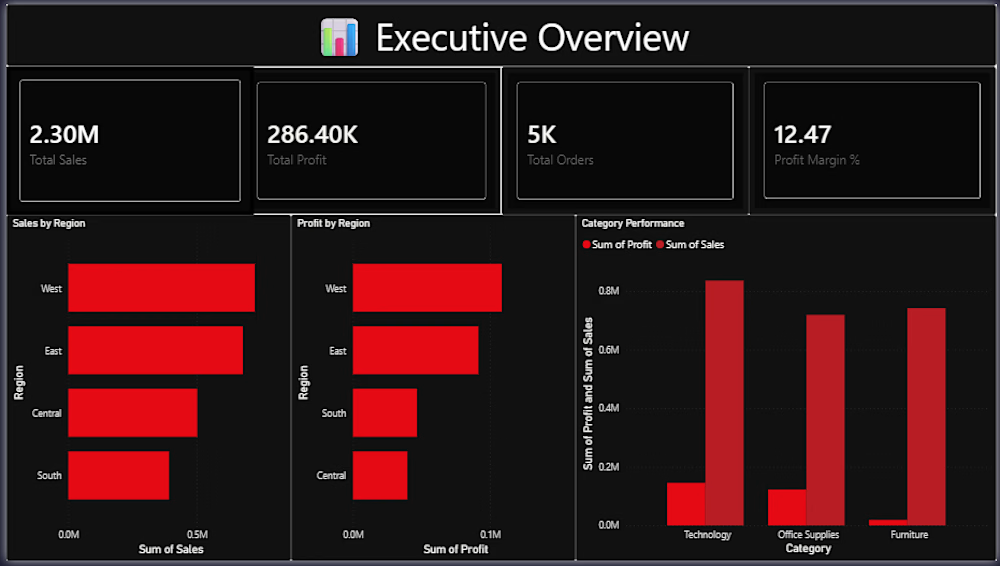
Executive Overview Total Sales Total Profit Total Orders Profit Margin Regional Sales Analysis Category Performance Analysis
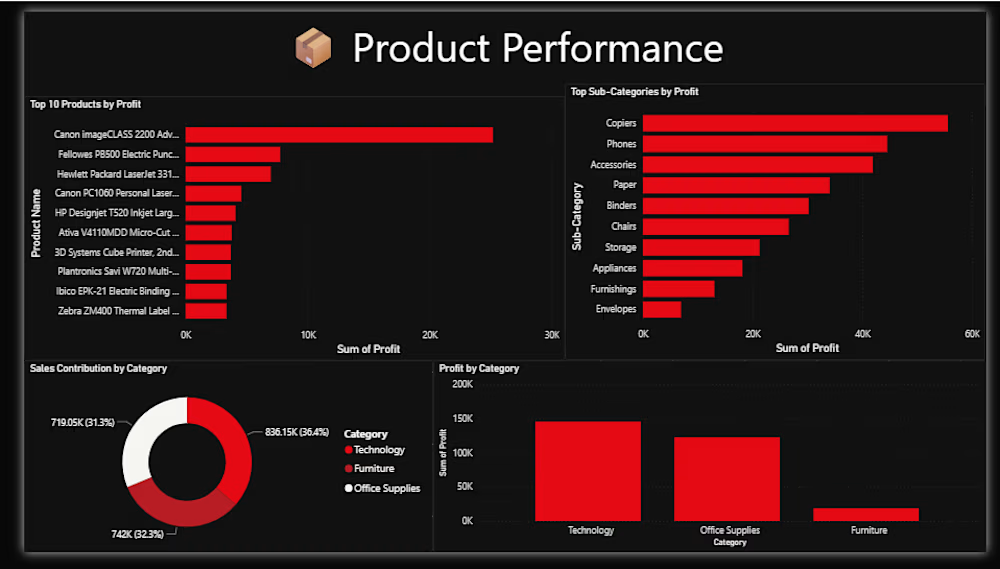
Product Performance Analysis Top Profitable Products Loss-Making Products Profit by Category Sales by Sub-Category
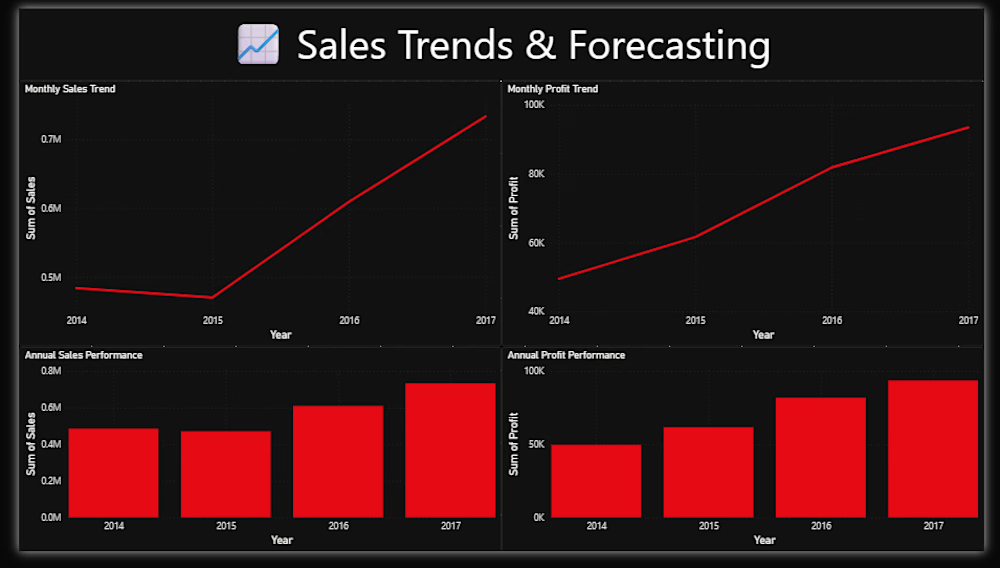
Sales Trends Analysis Sales Trends Over Time Profit Trends Seasonal Performance Insights Key Business Insights West Region generated the highest sales. Technology is the most profitable category. Several products generate significant losses and require pricing review. Sales performance varies significantly across regions. Automated AI Report The project includes a Python-based reporting system that automatically generates:
Total Sales
Total Profit
Business Insights
Strategic Recommendations
Author
Gourav Jangid
Aspiring Data Analyst
Open to Data Analytics Opportunities