The network for creativity
Join 1.25M professional creatives like you
Connect with clients, get discovered, and run your business 100% commission-free
Creatives on Contra have earned over $150M and we are just getting started
Back to feedPost

Infographic & Blog Content — The Inflation Cycle (In Mzansi)
Overview
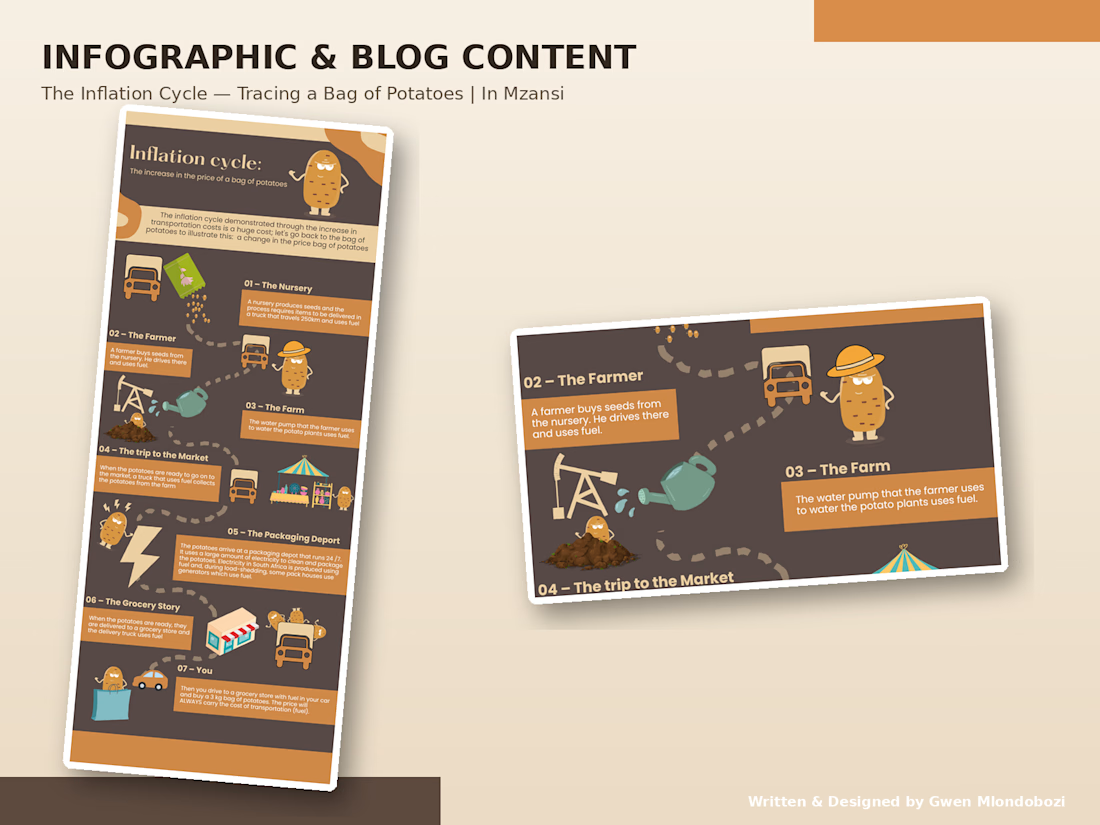
Designed an original infographic breaking down how fuel costs compound through a product's supply chain, using a bag of potatoes as the illustrative example — then wrote an accompanying blog article translating the visual into an accessible explainer for In Mzansi's Business section.
What I did
Designed a 7-step infographic ("The Inflation Cycle") mapping the journey of a bag of potatoes from seed nursery to grocery shelf, illustrating where fuel cost enters at each stage
Developed custom character illustrations, iconography, and a warm brown/orange colour system to keep a data-driven topic visually engaging
Wrote a full-length blog article unpacking each step of the infographic, connecting it back to real economic concepts (inflation, shrinkflation, purchasing power) and South African context (load-shedding's effect on packaging costs)
Closed the piece with practical, actionable takeaways for readers navigating rising prices

The network for creativity
Join 1.25M professional creatives like you
Connect with clients, get discovered, and run your business 100% commission-free
Creatives on Contra have earned over $150M and we are just getting started

Challenges
View all


Related posts

Animated Fintech UI for pie showing portfolio performance, Investment income, Investment advisory, and smart advisory features through interactive financial visualization
A motion exploration for Pie, bringing key wealth-management features to life through animated UI components.
The concept explores how portfolio performance, investment income, investment advisory, and smart advisory can be presented in a clear and engaging way while keeping the overall experience simple and premium.
A look at how motion can make financial products feel more intuitive, modern, and easier to understand.


The motion-led charts make a dense wealth-management story feel approachable; the distinct panels give each metric room to breathe while still reading as one system.


Good job

PhonePe × VISA — Product Launch Film
A fintech product launch video created for PhonePe × VISA, showcasing new payment solutions including Tap to Pay, Cross-Border Scan to Pay, and Smart Accept.
The video was showcased at Global Fintech Fest 2026 in Mumbai as part of the PhonePe product launch.
My role: Video Editing · Motion Design · Visual Development · Sound Design · Post-Production
#Fintech #MotionDesign #VideoEditing #PhonePe #VISA #GFF2026


