The network for creativity
Join 1.25M professional creatives like you
Connect with clients, get discovered, and run your business 100% commission-free
Creatives on Contra have earned over $150M and we are just getting started
Back to feedPost

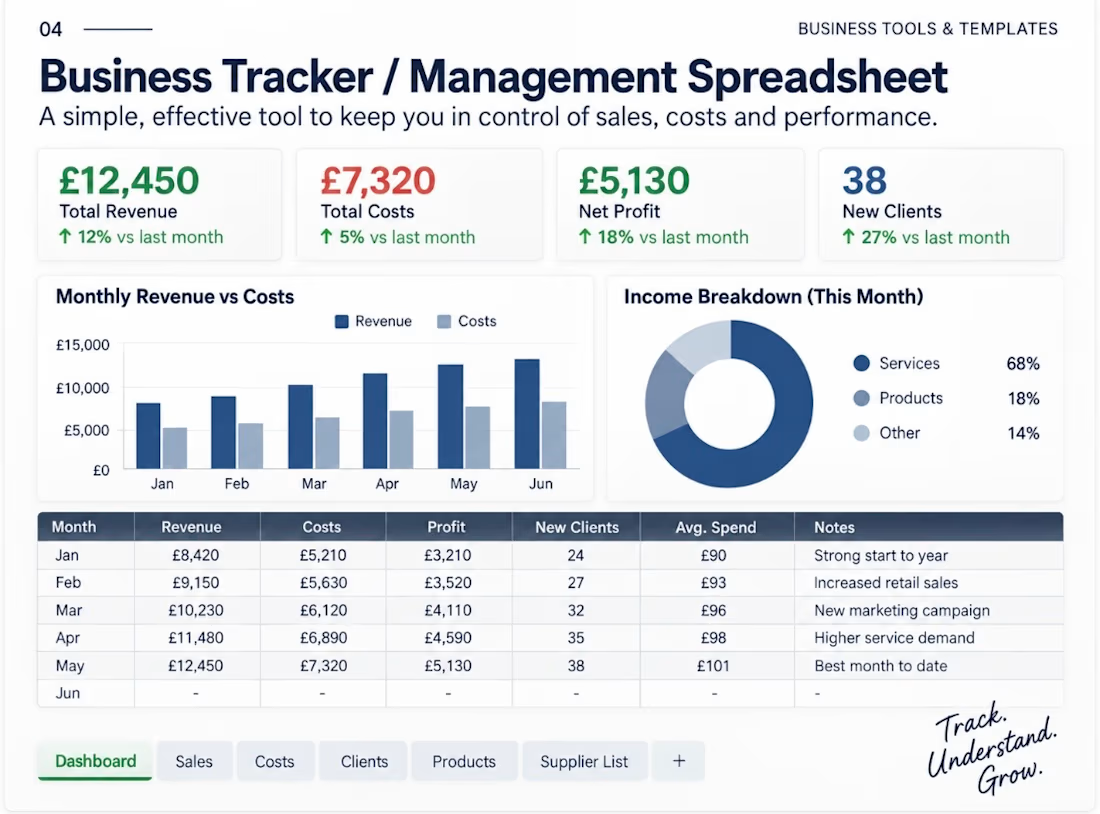
Business Tracker / Management Spreadsheet
A simple, effective tool to keep you in control of sales, costs and performance.

The network for creativity
Join 1.25M professional creatives like you
Connect with clients, get discovered, and run your business 100% commission-free
Creatives on Contra have earned over $150M and we are just getting started


Related posts

📊 Turn Business Data into Smarter Decisions
A great dashboard doesn't just display numbers — it helps businesses understand performance and make better decisions.
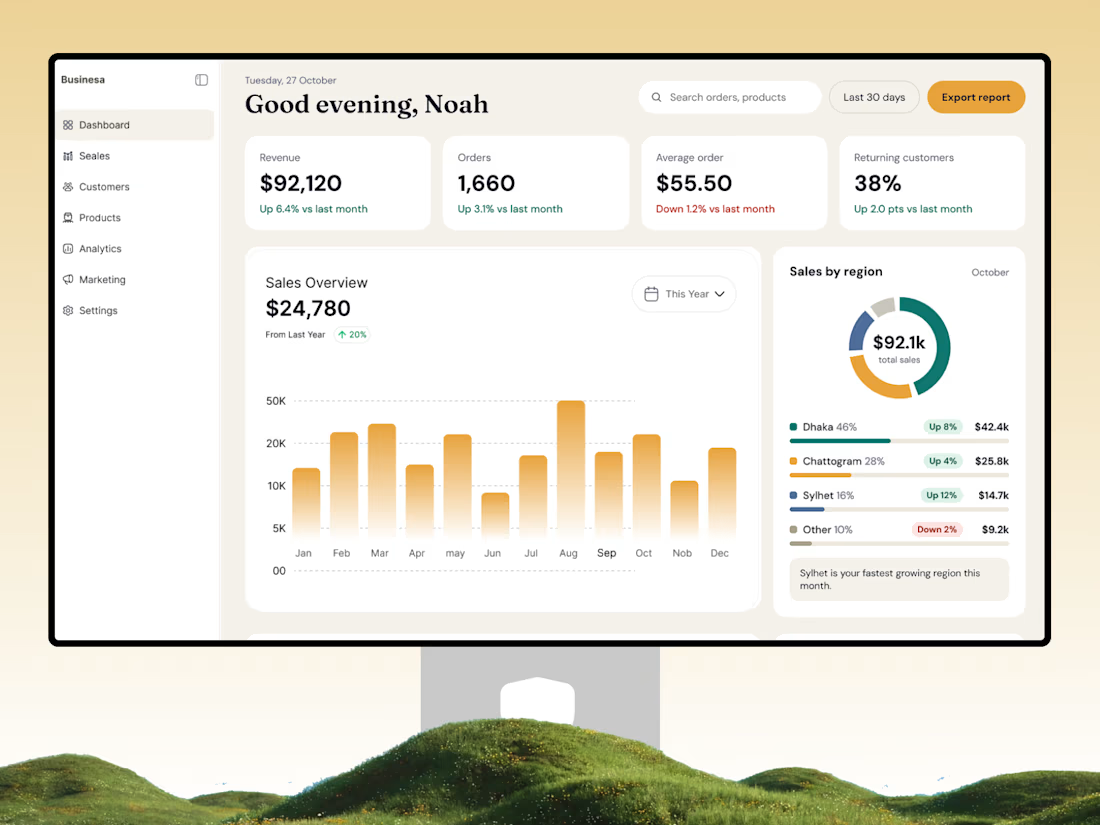
Introducing a modern Store Analytics Dashboard UI/UX Design by OrdainIT, designed for eCommerce businesses that need a clear view of their store performance.
✨ Design highlights:
Clean and intuitive dashboard interface
Revenue, orders, and customer analytics
Interactive sales overview and visual charts
Regional sales performance tracking
Key business metrics at a glance
Organized navigation and user-friendly layout
The goal is to simplify complex business data through a clean, structured, and easy-to-understand interface.
At OrdainIT, we design modern SaaS dashboards and digital products that combine usability with visual clarity.
💬 What's the most important metric you want to see first when opening an analytics dashboard?
#DashboardDesign #UIUXDesign #SaaSDesign #AnalyticsDashboard #ProductDesign #WebDesign #OrdainIT



That serif heading works so well.

Power BI Project Description🩻
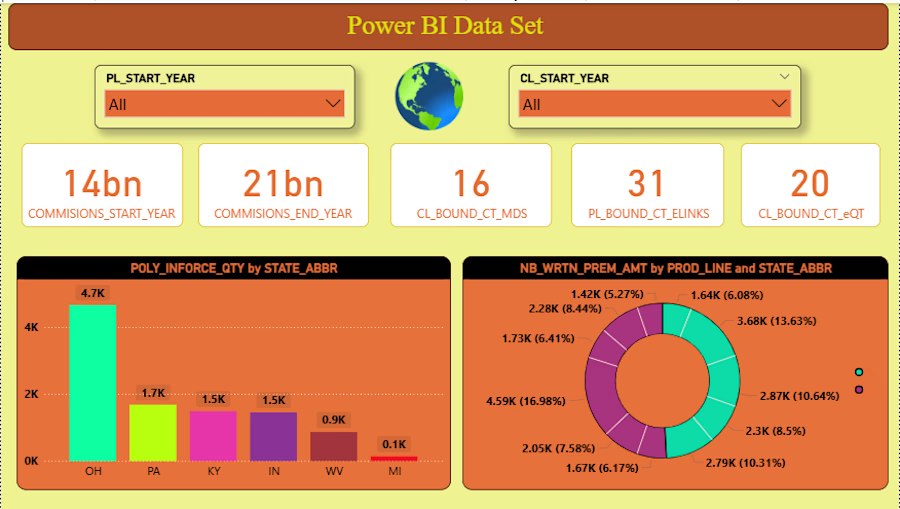
Sales Performance Dashboard | Power BI🙌
Developed an interactive Power BI dashboard to analyze sales performance, customer behavior, and business KPIs. The solution transforms raw data into actionable insights through dynamic visualizations and automated reporting.
Key Features:
Interactive KPI cards for Revenue, Inforce Policy Orders, and Growth
Sales analysis by State, Product Category, and Policy Segment
Dynamic slicers and drill-through functionality
Year-over-Year (YoY) performance tracking
Profitability and trend analysis using DAX measures
Data modeling with relationships and star schema design
Automated data refresh and optimized report performance
Tools & Technologies:
Power BI Desktop
Power Query
DAX
SQL / Excel Data Sources
Data Modeling & Visualization
Skills Tags🔥
Power BI • DAX • Power Query • Data Visualization • Business Intelligence • Dashboard Design • SQL • Data Analytics


🚀 Struggling to Manage Your Shopify Product Listings?
Running an online store takes time, and managing hundreds of products can become overwhelming.
Are you facing challenges with:
❌ Bulk product uploads?
❌ CSV import and export?
❌ Incorrect product variations and SKUs?
❌ Poor product titles and descriptions?
❌ Product image management?
❌ SEO and product organization?
I can help!
With 4+ years of eCommerce experience, I provide professional Shopify product management services.
✅ Single & Bulk Product Upload
✅ CSV Import & Export
✅ Product Variations & SKU Management
✅ Product Titles & Descriptions
✅ Product Image Upload
✅ SEO-Friendly Product Listings
✅ Store Catalog Management
My goal is to help store owners save time, maintain accurate product catalogs, and focus on growing their businesses.
🌍 Available for international clients.
📩 Have a Shopify project? Let's discuss your requirements!
#Shopify #ShopifyExpert #Ecommerce #ProductListing #ShopifyStore #EcommerceManagement #Freelancer