The network for creativity
Join 1.25M professional creatives like you
Connect with clients, get discovered, and run your business 100% commission-free
Creatives on Contra have earned over $150M and we are just getting started
Back to feedPost
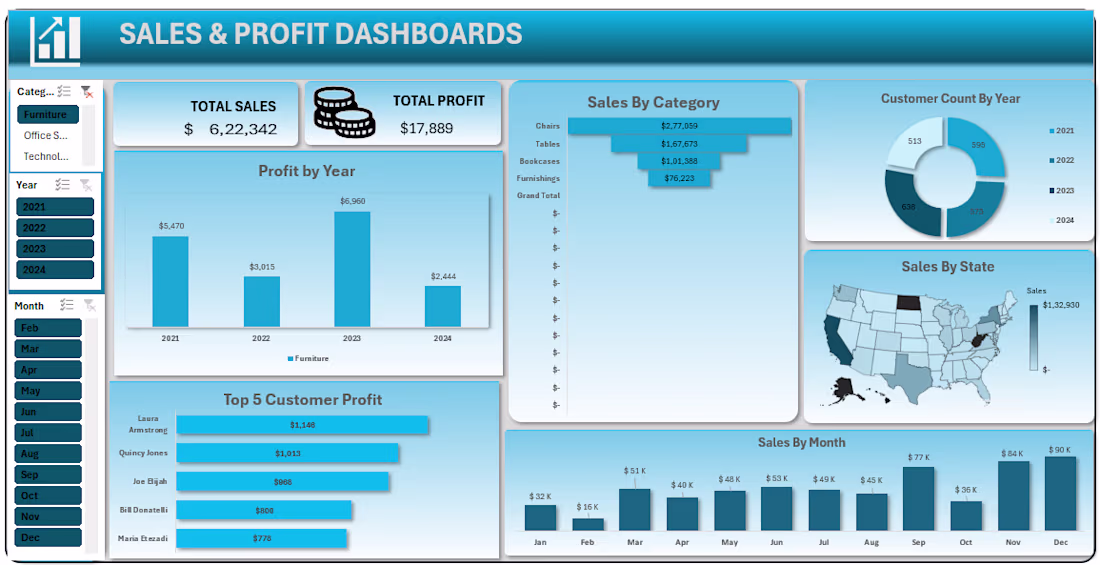
📊 Excited to share my latest Excel dashboard project!
I built an e-commerce sales & profit dashboard using Microsoft Excel to analyse business performance and generate actionable insights from sales data.
🔹 Key Highlights:
• Sales & Profit Analysis
• Region-wise Performance Tracking
• Category & Sub-category Insights
• Monthly Sales Trends
• Interactive Pivot Tables & Charts
• KPI Tracking Dashboard
🛠 Tools Used:
• Microsoft Excel
• Pivot Tables
• Pivot Charts
• Data Cleaning
• Dashboard Design
📈 Through this project, I improved my skills in data analysis, business reporting, and dashboard creation while learning how to convert raw data into meaningful insights.
Looking forward to learning more in Excel, Power BI, and data analytics.
#Excel #DataAnalytics #Dashboard #MIS #BusinessAnalytics #DataAnalysis #ExcelDashboard #PowerBI #Finance #LinkedInProjects
The network for creativity
Join 1.25M professional creatives like you
Connect with clients, get discovered, and run your business 100% commission-free
Creatives on Contra have earned over $150M and we are just getting started
Related posts
Title:
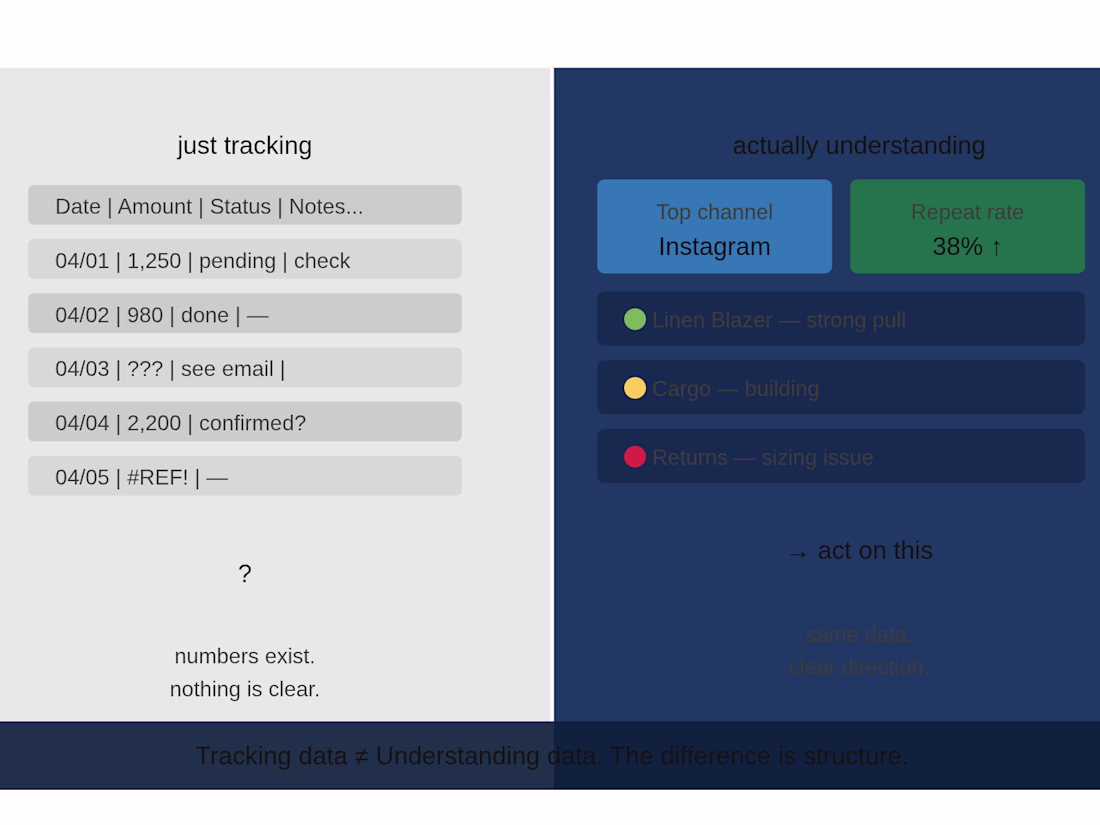
The difference between tracking data and understanding it
Most businesses are tracking data.
Very few are understanding it.
There is a difference — and it shows up in how decisions get made.
Tracking data means you have numbers somewhere. A spreadsheet updated every week. A report sent every month. An export sitting in someone's downloads folder.
Understanding data means those numbers tell you something specific. This channel is growing. This SKU is draining margin. This client segment is not renewing. Something you can act on before it becomes a problem.
The gap between the two is almost never about having more data. It is about structure.
Unstructured data gives you a feeling that things are being measured. Structured data gives you a direction.
I work with founders and business owners who have plenty of the first and very little of the second. The fix is usually simpler than they expect — not a new software, not a bigger team. Just a cleaner system around the data they already have.
If your numbers are being tracked but not really being used — that is the gap worth closing first.
Data VisualizationData AnalysisMicrosoft ExcelExcel VBAGoogle Sheetsbusinessintelligenceexceldashboarddatastructure
Peak Air HVAC Services (Local Service Business) Dark industrial/technical design. Covers a Charlotte HVAC contractor stuck at $618K with only 47 maintenance contracts and a Google Ads dependency. Includes real HVAC market benchmarks, CLV gap analysis ($2,800 captured vs. $15,340 potential), competitor table with actual Charlotte firms, and a 6-step plan showing a $242K total opportunity.

Harmon & Associates Law (Professional Services) Dark editorial design with serif typography. Covers a 3-attorney Austin estate planning firm with real industry financials — $387K revenue at 8.4% below benchmark margin, competitor rate table vs. actual Austin firms, full P&L, funnel leakage analysis, and a 6-step action plan showing a $245K identified opportunity.

Trending
Claude
Claude has entered the design space. How are you using Claude Design?
Contra University
Learn from expert creatives how to earn more using next-gen AI tools.
creativeaiflow
Creative AI workflows are evolving. What tools do you use, and what are their strengths and weaknesses?
portfolioreview
The best portfolios tell a story, not just show a grid. Share yours for feedback.
freelancerlife
Freelancer life is wins, pivots, and everything in between. What’s yours right now?