The network for creativity
Join 1.25M professional creatives like you
Connect with clients, get discovered, and run your business 100% commission-free
Creatives on Contra have earned over $150M and we are just getting started
Back to feedPost

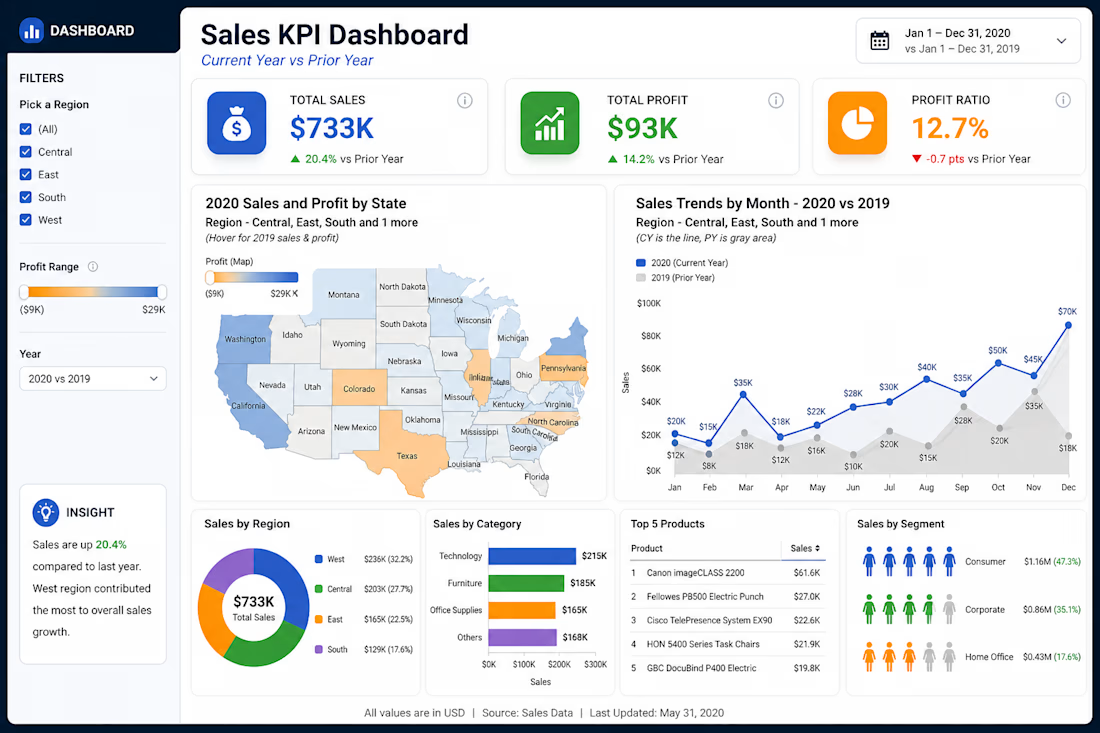
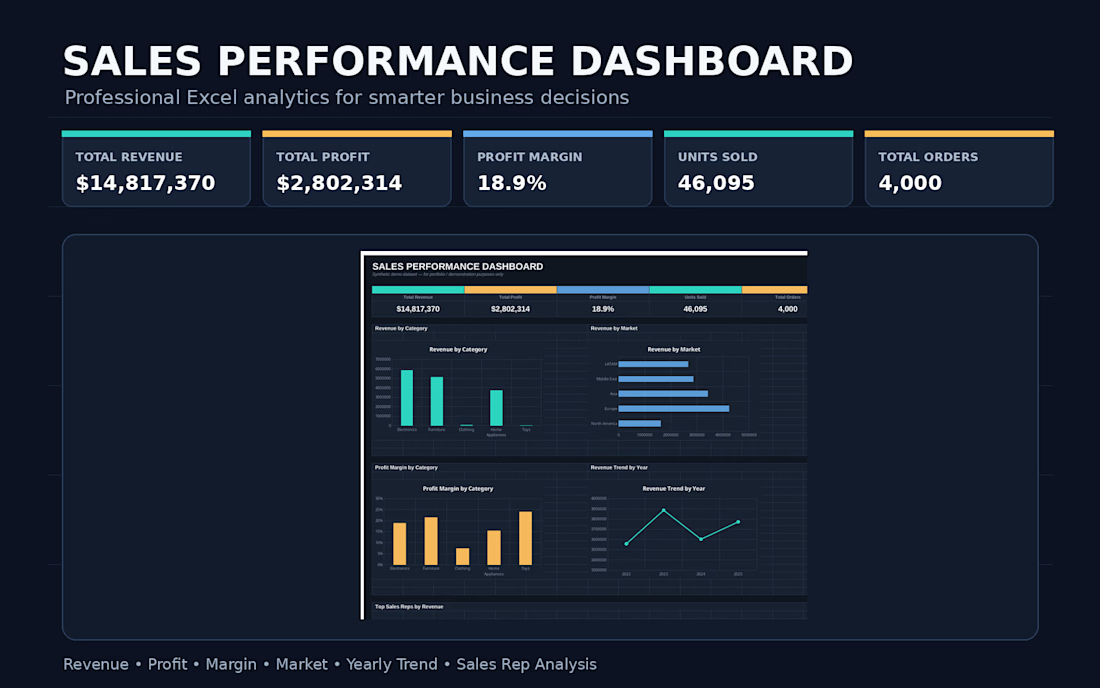
Sales KPI Dashboard | Data Analysis & Visualization : An interactive Sales KPI Dashboard designed to provide a clear view of business performance and support data-driven decision-making.
The analysis compares 2020 sales performance against the prior year across key metrics, including total sales, total profit, and profit ratio.
Key dashboard features include:
• Sales and profit performance by state and region
• Monthly sales trends compared with the previous year
• Sales distribution across regions and customer segments
• Sales performance by product category
• Top-performing products
• Interactive filters for region, profit range, and reporting period
• Automatically generated business insights highlighting key performance changes
The dashboard was designed to transform raw sales data into a clear and interactive reporting solution, making it easier to monitor performance, identify trends, and explore key business metrics.
Tools used: Data Analysis, Microsoft Excel, Data Visualization


The network for creativity
Join 1.25M professional creatives like you
Connect with clients, get discovered, and run your business 100% commission-free
Creatives on Contra have earned over $150M and we are just getting started
Trending
retrofuturism
Share your favorite designs from the past exploring the distant future. Or your own take on the aesthetic 🚀
halftone
Dots. Texture. Grain. Let's see your designs using the halftone technique.

Midjourney
Creatives are showing off what they're making with Midjourney.
colorgrade
Video editors sound off: How do you enhance the mood of your video in color grading?
Related posts


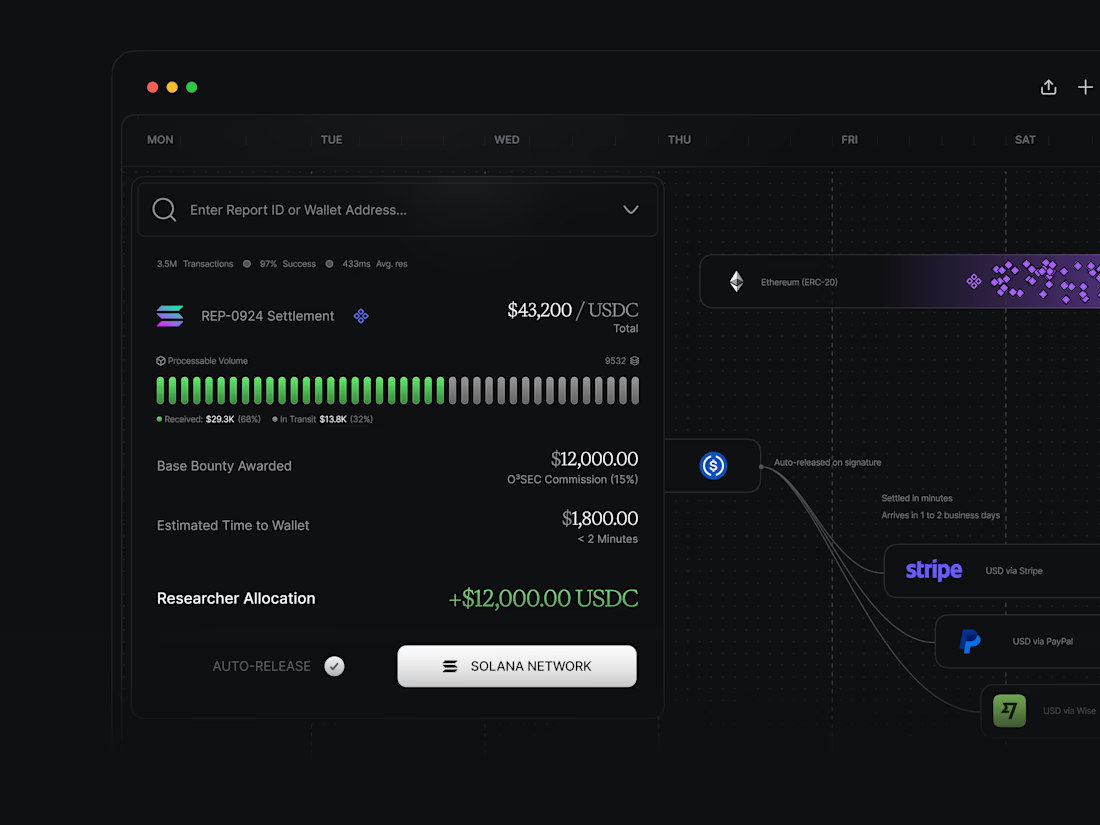
UI Dashboard screen explorations with a different type of dither for expressing scale



amazing work Praveen

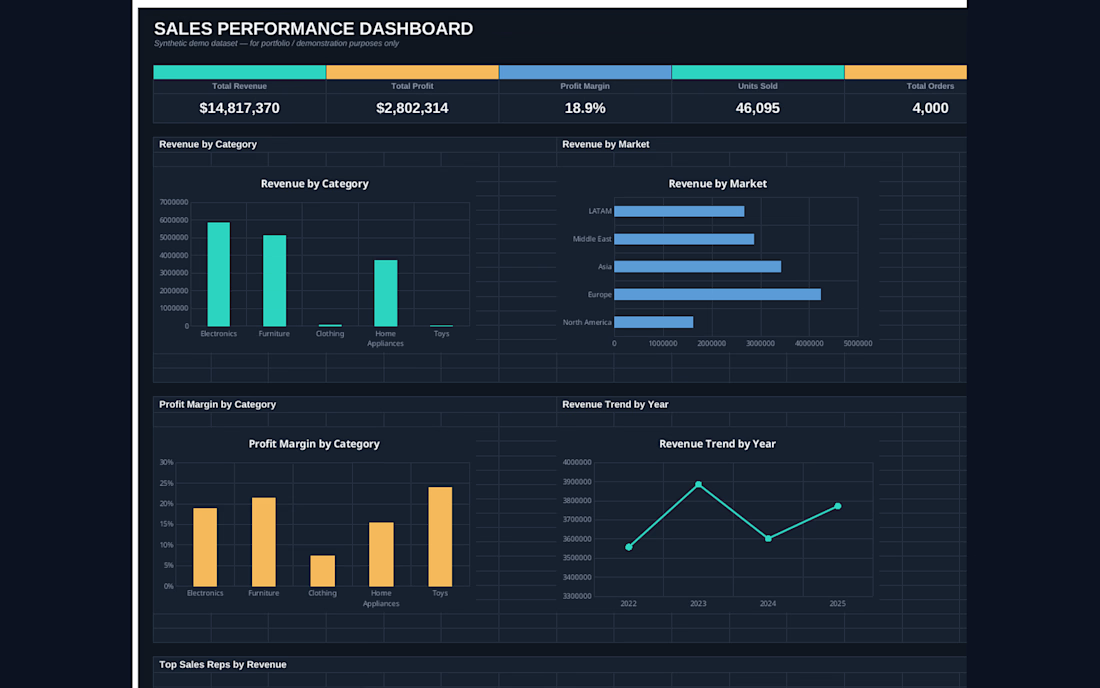
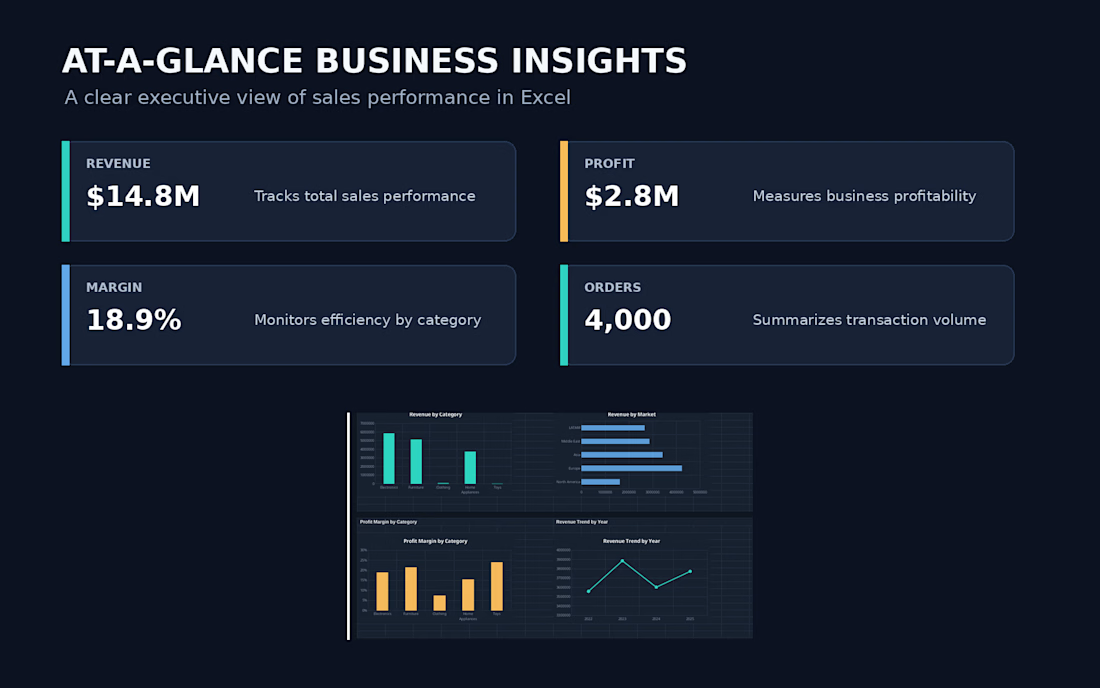

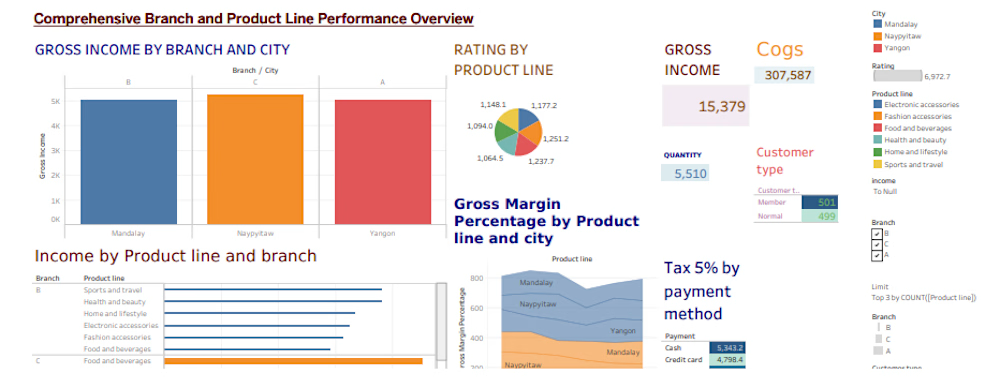
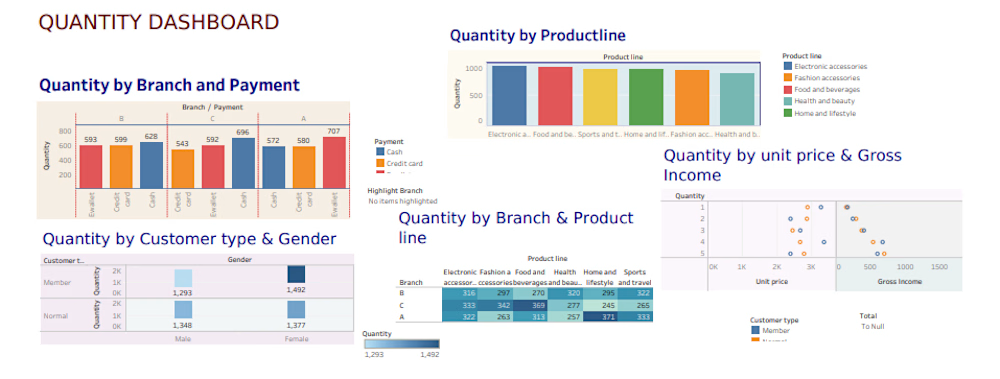
Retail Sales & Gross Income Intelligence Dashboard:
Analyzed 15k+ item quantities across multiple store branches, product lines, and payment types. Designed an interactive dashboard focusing on volume drivers, payment methods, customer membership distribution, and profitability margins.