The network for creativity
Join 1.25M professional creatives like you
Connect with clients, get discovered, and run your business 100% commission-free
Creatives on Contra have earned over $150M and we are just getting started
Back to feedPost
Designed an interactive Excel sales dashboard using pivot tables, slicers, and dynamic charts to analyze sales performance across regions, product categories, customers, and time periods.The dashboard helps identify trends, monitor KPIs, and support smarter business decisions.
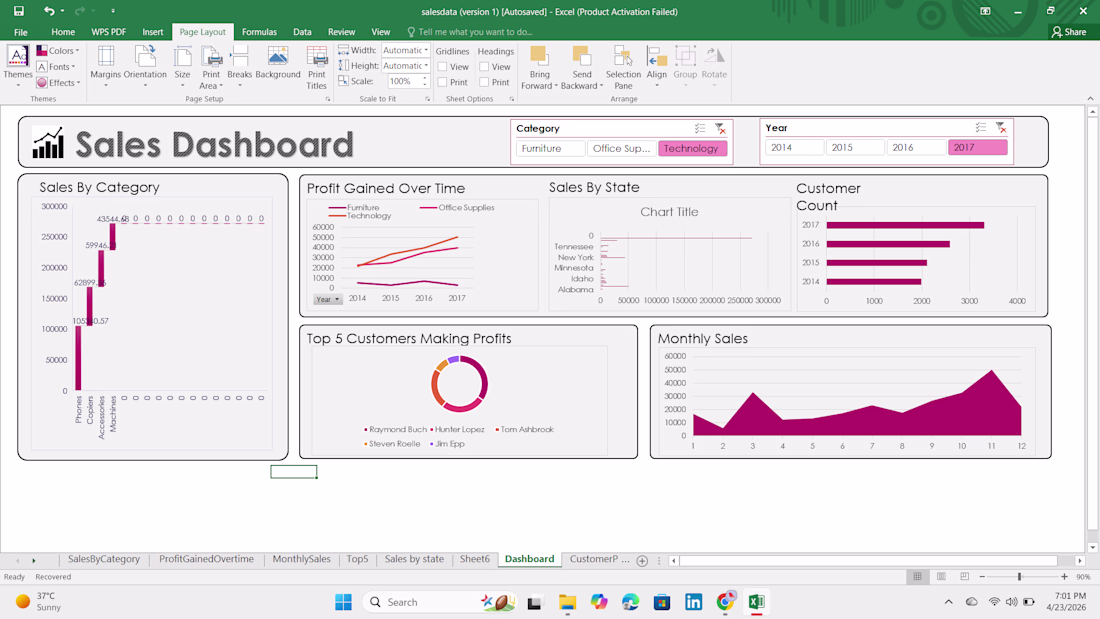
Love how you've combined slicers with dynamic charts — the category and year filters make this instantly usable for business decisions without any extra explanation needed. The Top 5 Customers and Monthly Sales panels together tell a complete story. Clean and practical work Myra!
The network for creativity
Join 1.25M professional creatives like you
Connect with clients, get discovered, and run your business 100% commission-free
Creatives on Contra have earned over $150M and we are just getting started
Related posts
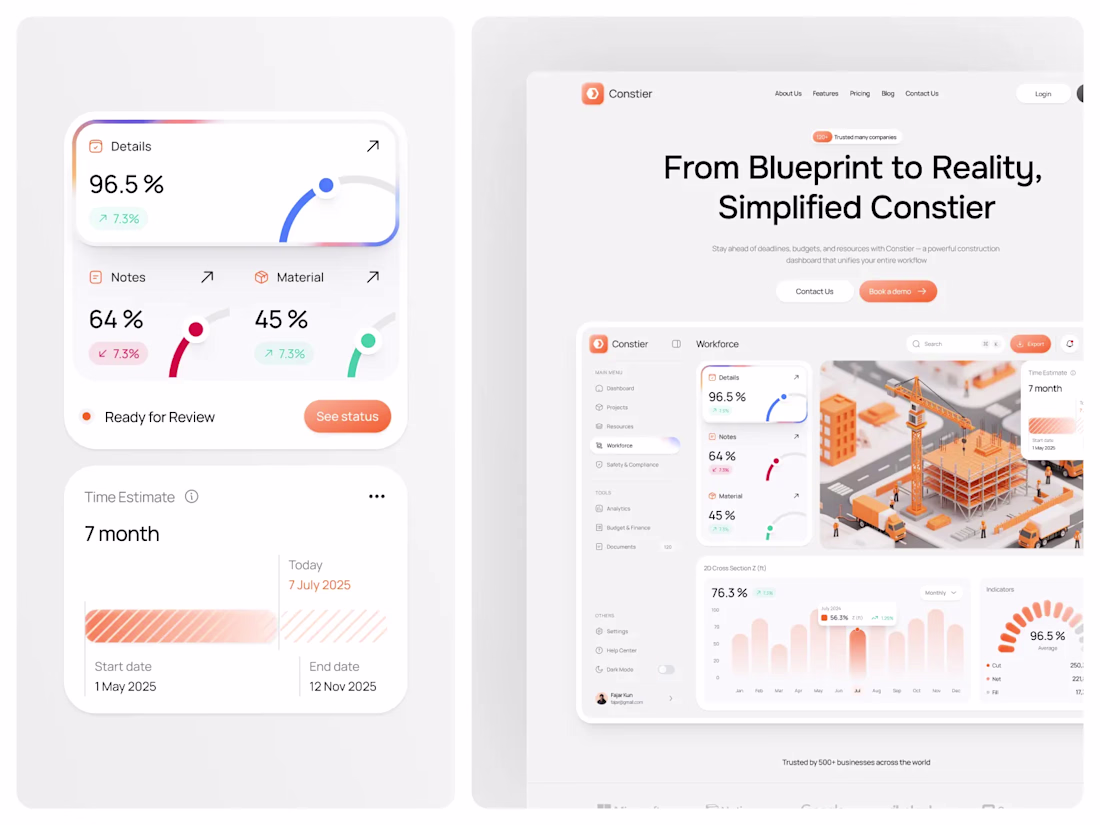
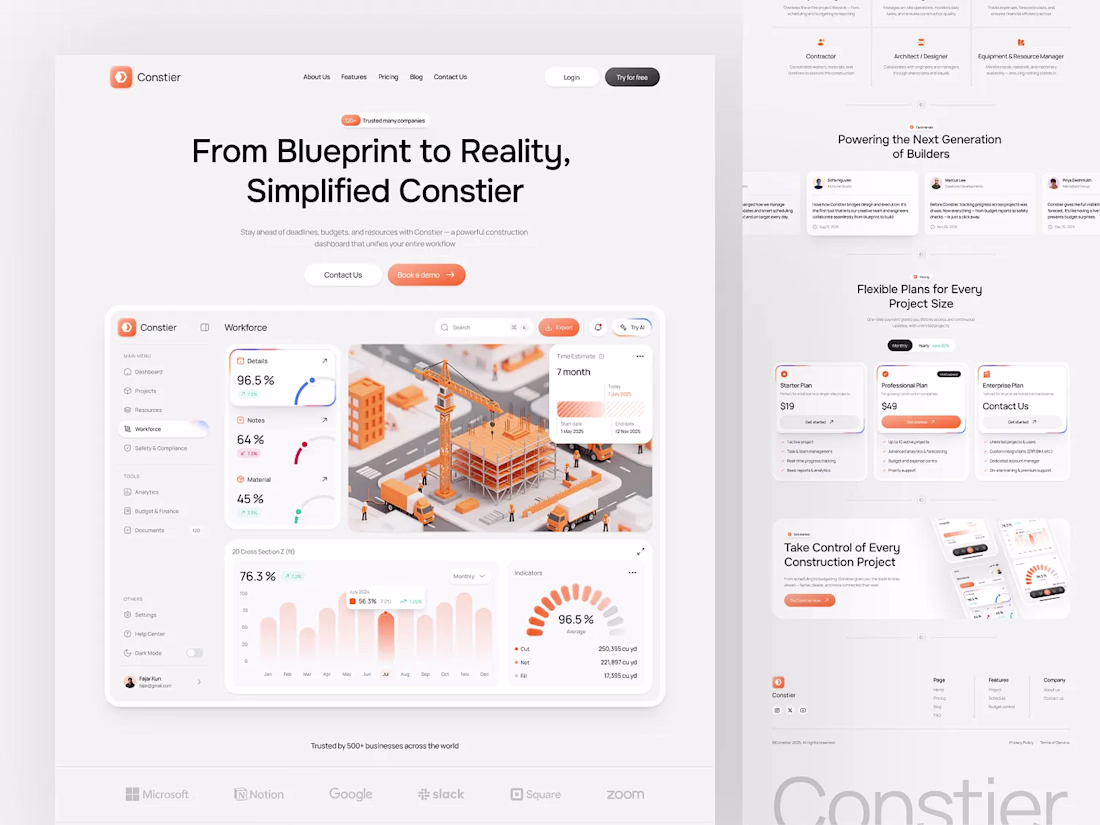
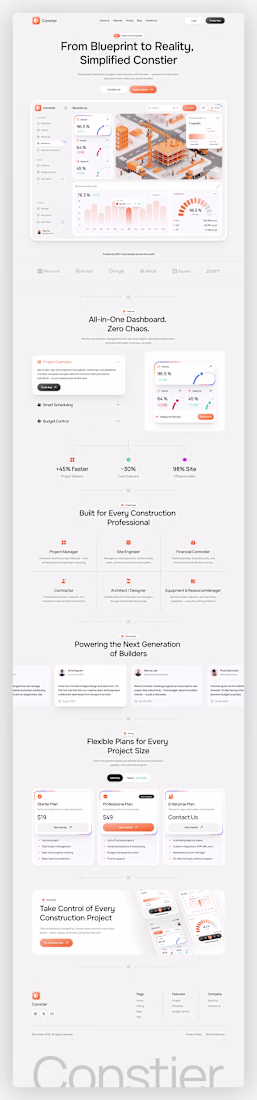
🏗️ Constier – Construction Dashboard
Constier is a modern construction management dashboard designed to streamline project monitoring, resource allocation, and workforce coordination in real-time. It empowers contractors, project managers, and engineers with a clear, data-driven view of every construction site.
Have a project? Let's Discuss and Collaborate!

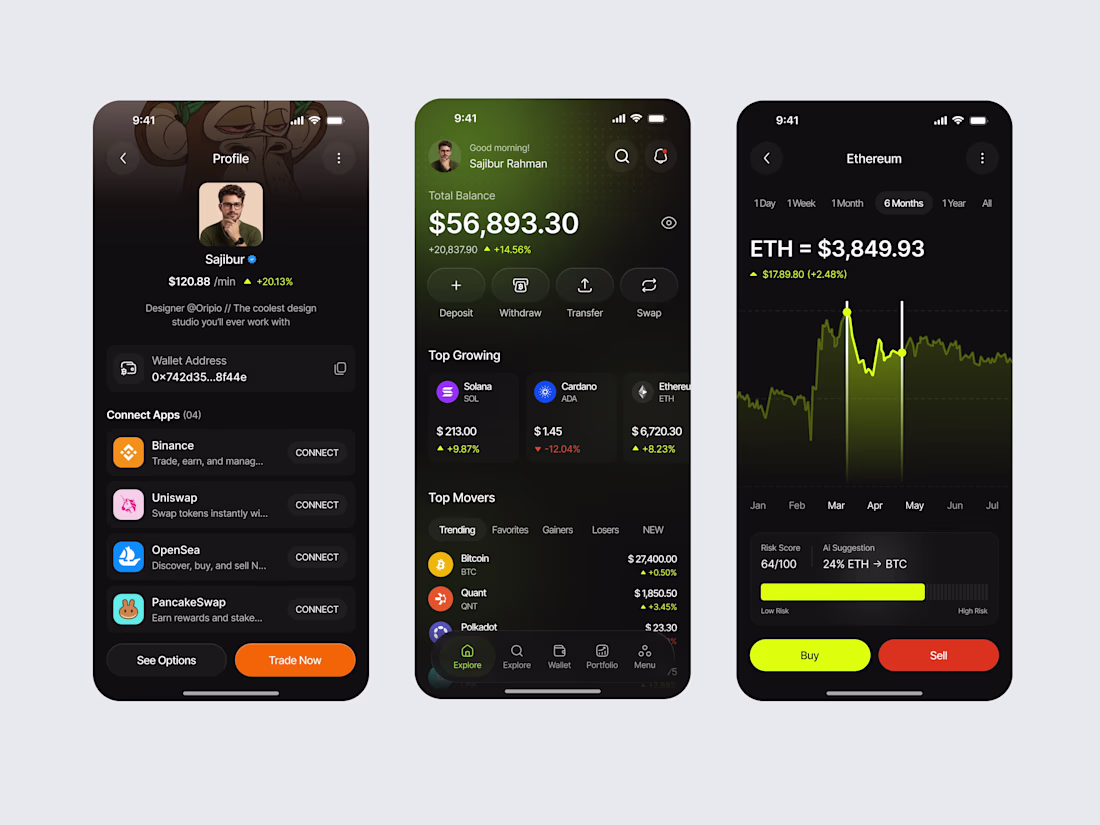
Designed a modern Crypto Finance App focused on clarity, usability, and real-time portfolio tracking.
The goal was to make complex financial data feel simple and intuitive.
- Clean dashboard experience
- Smart portfolio overview
- Modern dark UI
- User-friendly data visualization
Tools: Figma
Available for UI/UX freelance projects & collaborations.
Ever stared at a spreadsheet and thought... there's got to be a better way?
That's where I come in. I'm a Power BI specialist who transforms raw financial data into interactive dashboards.
This company had 6 months of unorganized data. No idea which divisions were profitable. Four million dollars stuck in unpaid invoices.
I cleaned the data, built an interactive dashboard, created advanced metrics using DAX, and delivered a full strategic analysis.
Result? They found 1.3 million dollars in working capital they didn't know they had.
That's the power of business intelligence. If you need financial dashboards, data integration, or strategic analysis... I'm your person.
The unpaid invoice problem is one of the most common and most expensive data blind spots in mid-sized businesses — the money exists but nobody can see it clearly enough to act on it. Finding $1.3M in working capital from 6 months of unstructured data is a result that speaks...
Trending
Claude
Claude has entered the design space. How are you using Claude Design?
Contra University
Learn from expert creatives how to earn more using next-gen AI tools.
creativeaiflow
Creative AI workflows are evolving. What tools do you use, and what are their strengths and weaknesses?
portfolioreview
The best portfolios tell a story, not just show a grid. Share yours for feedback.
freelancerlife
Freelancer life is wins, pivots, and everything in between. What’s yours right now?