The network for creativity
Join 1.25M professional creatives like you
Connect with clients, get discovered, and run your business 100% commission-free
Creatives on Contra have earned over $150M and we are just getting started
Back to feedPost

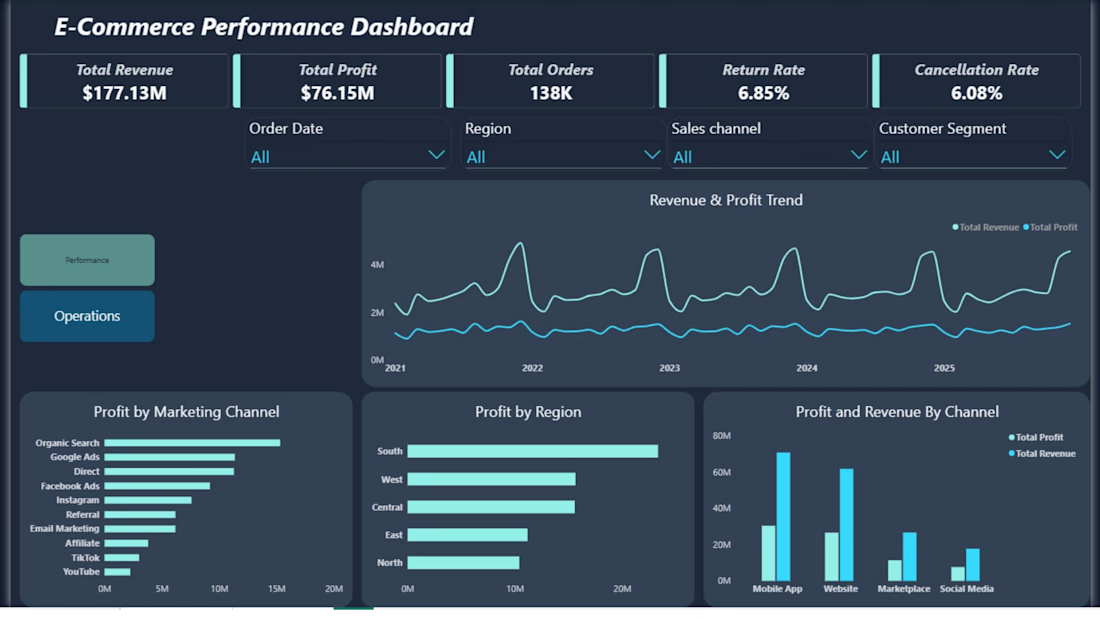
Turned an e-commerce dataset into a two-page Power BI dashboard, from raw data to final visuals.
Performance page: revenue, profit, orders, marketing channels and regions.
Operations page: cancellations, payment status, customer types and order activity.
A few things the data showed:
→ The South region and Organic Search bring in the most profit
→ Mobile App has the highest revenue and profit, but also the most cancellations
→ Loyal customers generate almost all of the profit, while new customers add very little
I kept the two pages separate on purpose: one shows how the business is doing, the other shows what's happening behind those numbers.
The data cleaning and analysis were done in Python, and the full process and dashboard are on
GitHub: https://github.com/mousumiparvinnn/ecommerce-performance-operations-dashboard
I help businesses clean their data and turn it into dashboards like this. If that's useful to you, send me a message.
#PowerBI #Python #DataAnalytics #DataVisualization #Ecommerce
The network for creativity
Join 1.25M professional creatives like you
Connect with clients, get discovered, and run your business 100% commission-free
Creatives on Contra have earned over $150M and we are just getting started

Challenges
View all


Related posts


The overall feel of the site is really amazing 🙌

You don't need to be afraid of shating BTS of your work because that's what real designing is all about.
It's a mess until it's beautiful
I believe the one thing you can be obsessed in your dashboard concepts is to be breaking down information and see what the end result look like?
Whenever I have Saas B2B designs or mainly dashboard designs to work on. I am the happiest.
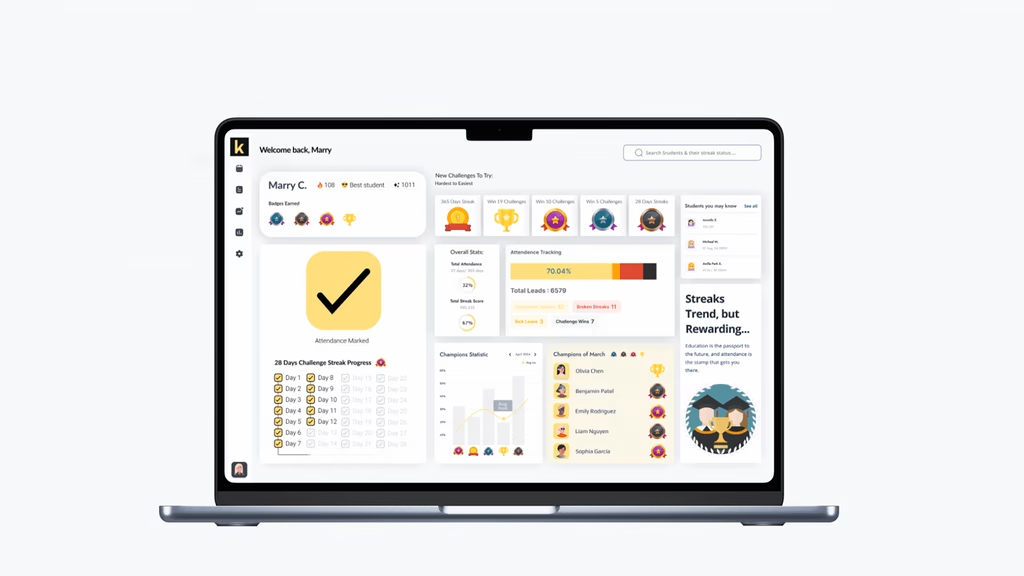

The annotated dashboard breakdown is especially helpful—the yellow progress block creates an immediate focal point, while the row of colorful challenge icons adds a friendly rhythm without overwhelming the data. That balance between scanability and personality feels right for a student-facing SaaS product.

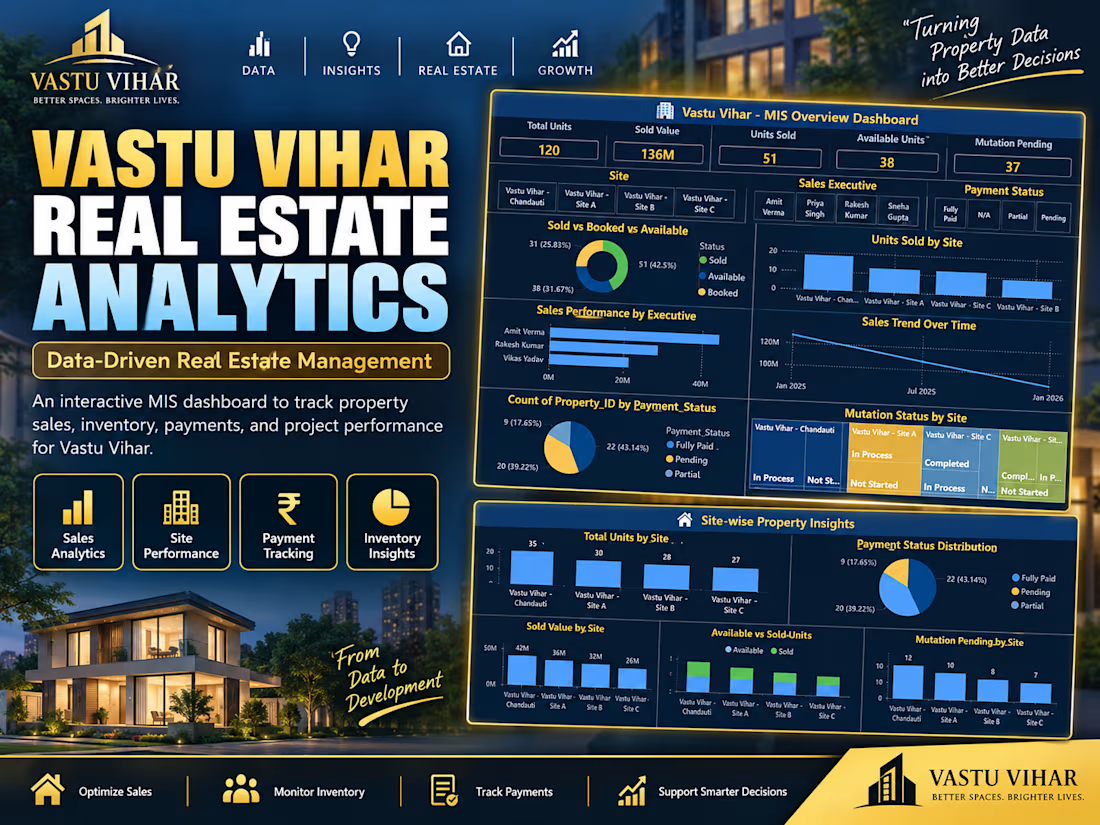
Turning property data into better decisions 🏠📊 Built a full MIS dashboard for a real estate business — tracking 120 units across 4 sites, ₹13.6Cr in sales, payment status, and mutation progress, all in one Power BI view. Excel + Power BI + data modeling. #DataAnalytics #PowerBI #RealEstateAnalytics #Excel #DashboardDesign